WTI Price Analysis: Corrective pullback fades below $95.00
- WTI retreats from intraday high as it tries to pare the previous day’s losses.
- Convergence of six-week-old resistance line, 23.6% Fibonacci retracement guards immediate upside.
- 200-DMA, horizontal area from mid-March challenges bears targeting the yearly low.
WTI crude oil prices take a U-turn from the daily top around $95.00 as buyers struggle to retake control after the bear's multiple failures to break the 200-DMA. In doing so, the black gold reverses the previous day’s pullback from a six-week-old descending trend line during Wednesday’s Asian session.
Considering downbeat RSI (14) and the commodity’s failure to cross the aforementioned resistance line, the quote is likely to drop back towards the 200-DMA support of $93.85.
Should the WTI bears manage to conquer the $93.85 DMA support, a horizontal area comprising multiple levels marked since mid-March, around $92.40-60, will be important to watch.
In a case where the commodity prices stay bearish past $92.40, the yearly low of $88.34 should gain the seller’s attention.
Alternatively, recovery remains elusive until the quote stays below the $97.50 resistance confluence including the 23.6% Fibonacci retracement level of the March-July downturn and a descending trend line from June 14.
Even so, the monthly horizontal resistance area near $103.00 will be a tough nut to crack for the WTI bulls.
WTI: Daily chart
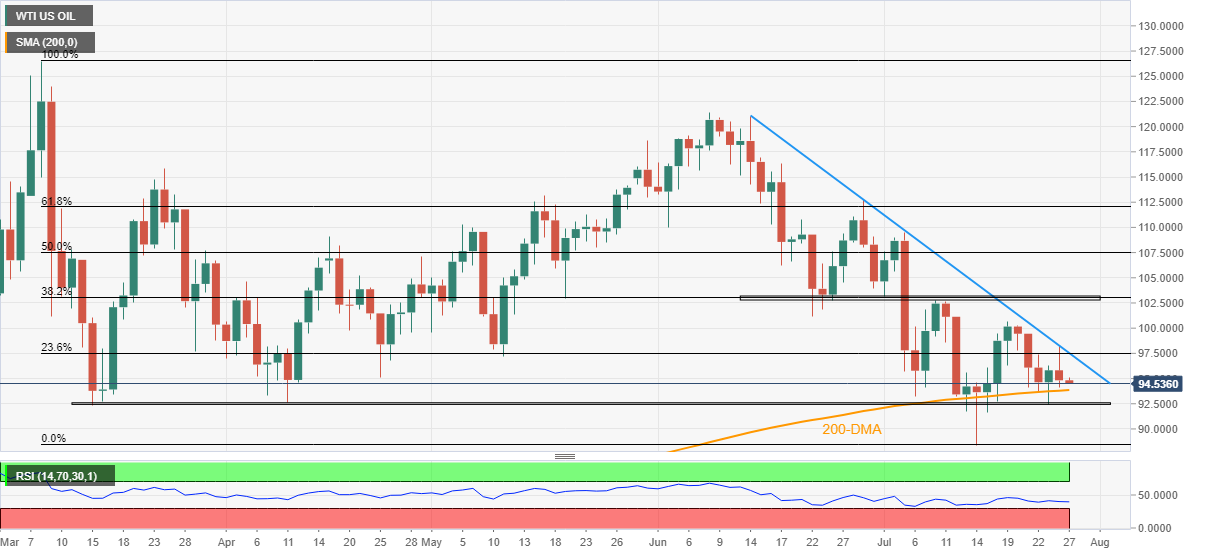
Trend: Bearish