WTI Price Analysis: Bulls flex muscles on the way to $115.00
- WTI holds onto the early-week triangle breakout around six-week high.
- Firmer RSI, not overbought, joins higher-low pattern to favor further upside.
- Two-month-old horizontal area to challenge bulls ahead of March’s top.
WTI bulls attack $108.00 by keeping the previous triangle breakout near the highest levels since late March. That said, the black gold prints a three-day uptrend during early Friday.
In addition to the triangle breakout, firmer RSI conditions and recent higher-low formation also keep WTI oil buyers hopeful.
The current upside aims for the $110.00 threshold before the latest multi-day peak of $110.30 test the buyers.
It should be noted, however, that the quote’s upside past $110.30 will need validation from the $114.60-80 region, comprising multiple tops marked since March, to keep oil bulls on the table.
Alternatively, pullback moves may initially aim for the previous resistance line of the seven-week-long symmetrical triangle, around $103.00, a break of which will direct the commodity prices towards the triangle’s support line, near $95.80.
In a case where WTI crude oil drops below $95.80, the 100-DMA level of $93.60 will be crucial to watch before confirming the bear run.
WTI: Daily chart
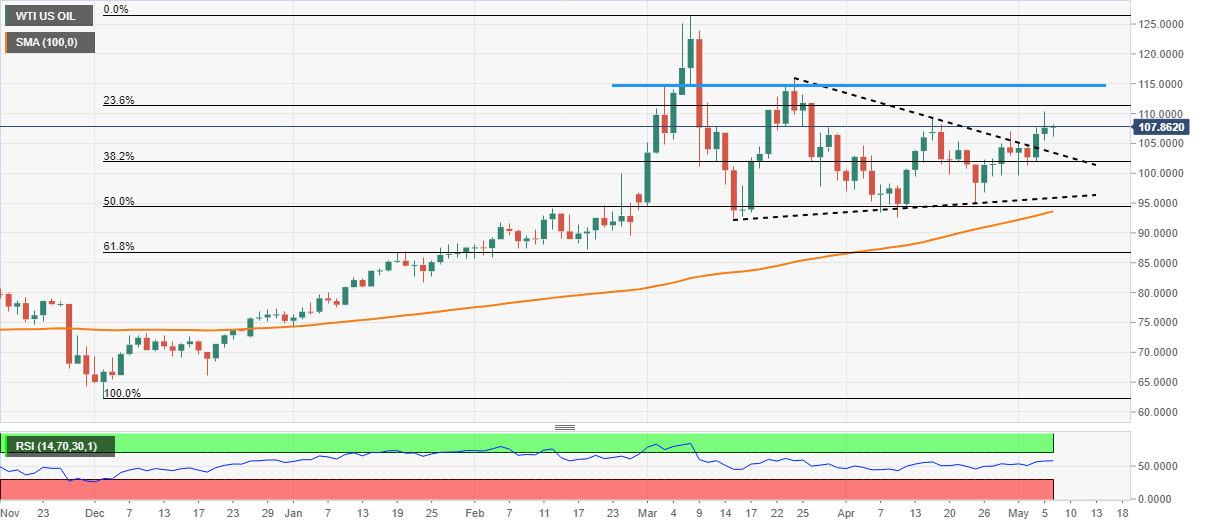
Trend: Further upside expected