Gold Price Forecast: XAU/USD looks vulnerable whilst below $1,941 – Confluence Detector
- Gold price remains stuck in a familiar range below $1,940, lacking a clear direction.
- Treasury yields firm up on hawkish Fed while the Russia-Ukraine crisis rages on.
- Gold bulls to face an uphill battle amid hawkish Fed, Ukraine saga.
Amidst the hawkish Fed’s outlook and the Russia-Ukraine stand-off, gold price is struggling to find a clear direction. The bright metal continues to gyrate in a $20 narrow range so far this week, looking for a decisive break in either direction. Fed Chair Jerome Powell remains confident on the US economy, backing a 50bps rate hike in May. The aggressive Fed’s tightening plans have pushed the US Treasury yields through the roof, capping gold’s upside. Meanwhile, increased Russian hostilities on Ukraine and a stalemate on the peace talks keep the downside cushioned in gold price.
Read: Gold Price Forecast: XAU/USD to offset Fed rate hikes by virtue of safe-haven demand – ANZ
Gold Price: Key levels to watch
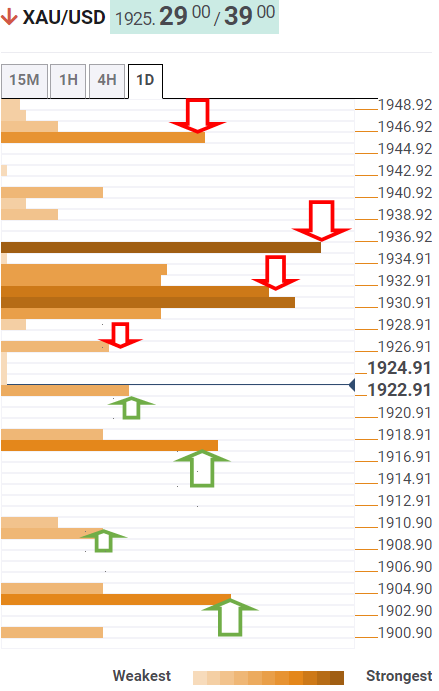
The Technical Confluences Detector shows that gold price is extending declines to test the pivot point one-day S1 at $1,923.
Acceptance below that level will call on sellers to target strong support at $1,918, which is the convergence of the Fibonacci 23.6% one-week, the previous day’s low and Bollinger Band four-hour Lower.
If the sell-off intensifies, then a sharp drop towards the confluence of the SMA200 four-hour and the pivot point one-day S2 at $1,909 cannot be ruled out.
The intersection of the Fibonacci 161.8% one-day and Fibonacci 38.2% one-month at $1,904 will be a level to beat for gold bears.
Alternatively, if bulls jump back into the game, then immediate resistance is seen at $1,926, the Fibonacci 61.8% one-day.
Further up, gold bulls will need to find a strong foothold above a dense cluster of resistance levels around $1,931.
That level comprises of SMA5 one-day, SMA10 four-hour, Fibonacci 38.2% one-day and one-week.
The next powerful upside barrier is that of the Fibonacci 26.3% one-day, where the $1,936 level aligns.
The previous day’s high of $1,941 will be next on buyers’ radars on a sustained move higher.
Here is how it looks on the tool
About Technical Confluences Detector
The TCD (Technical Confluences Detector) is a tool to locate and point out those price levels where there is a congestion of indicators, moving averages, Fibonacci levels, Pivot Points, etc. If you are a short-term trader, you will find entry points for counter-trend strategies and hunt a few points at a time. If you are a medium-to-long-term trader, this tool will allow you to know in advance the price levels where a medium-to-long-term trend may stop and rest, where to unwind positions, or where to increase your position size.