US Dollar Index Price Analysis: Bullish pennant breakout favor DXY bulls on Fed day
- DXY retreats from weekly top, snaps two-day uptrend.
- Bearish MACD signals, three-week-old horizontal area challenges bullish chart pattern’s confirmation.
- 10-DMA, 20-DMA guards immediate downside, yearly top adds to the upside filters.
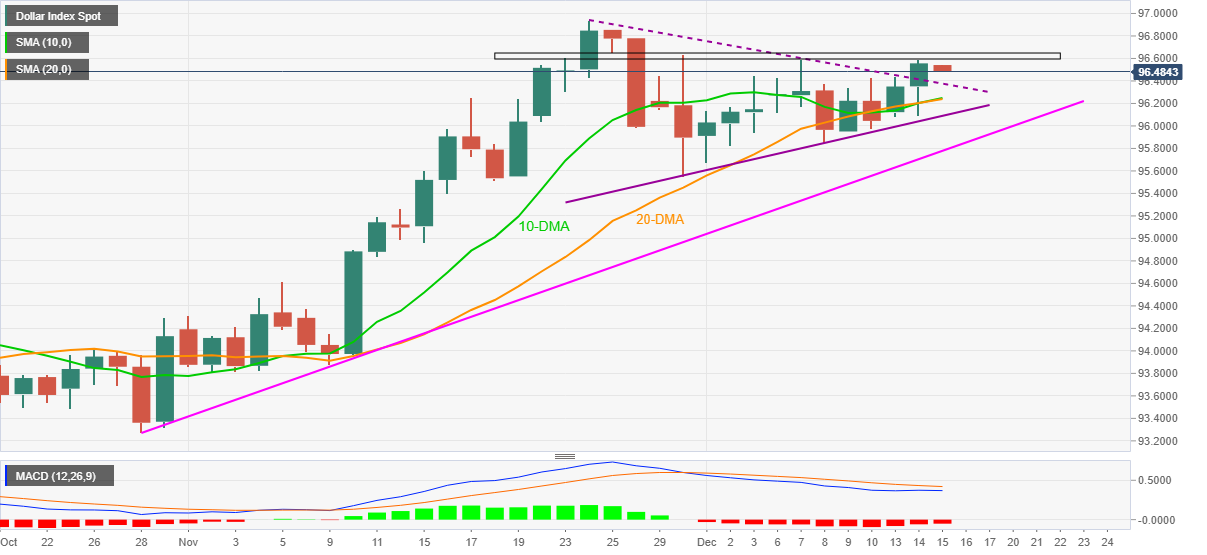
US Dollar Index (DXY) eases from a weekly high to 96.48 during early Wednesday, despite confirming a bullish pennant the previous day.
Market’s anxiety ahead of the key Federal Open Market Committee (FOMC) meeting and bearish MACD joins the horizontal area from November 23 to challenge the greenback bulls of late.
However, sellers are less likely to take risk of entry until the quote drops back below the previous resistance line of the said pennant, around 96.35 at the latest.
Adding to the downside filters is the convergence of the 10-DMA and 21-DMA followed by the pennant’s support line, respectively around 96.25 and 96.05.
Even if the DXY declines below 96.05, the 96.00 threshold and an ascending support line from October 28, near 95.77, will be important to watch for the bears.
Alternatively, an upside clearance of the 96.65 hurdle will direct the US Dollar Index bulls towards the yearly top of 96.94 and then to 97.00.
However, any further upside past 97.00 won’t hesitate to challenge the June 2020 peak of 97.80.
Read: Fed Interest Rate Decision Preview: Can the FOMC satisfy and mollify the markets?
DXY: Daily chart
Trend: Further upside expected