AUD/USD Price Analysis: Seesaws around 0.7200 inside monthly falling wedge
- AUD/USD struggles to extend bounce off two-month low inside bullish chart pattern.
- Oversold RSI hints at a corrective pullback, key DMA convergence challenges the bulls.
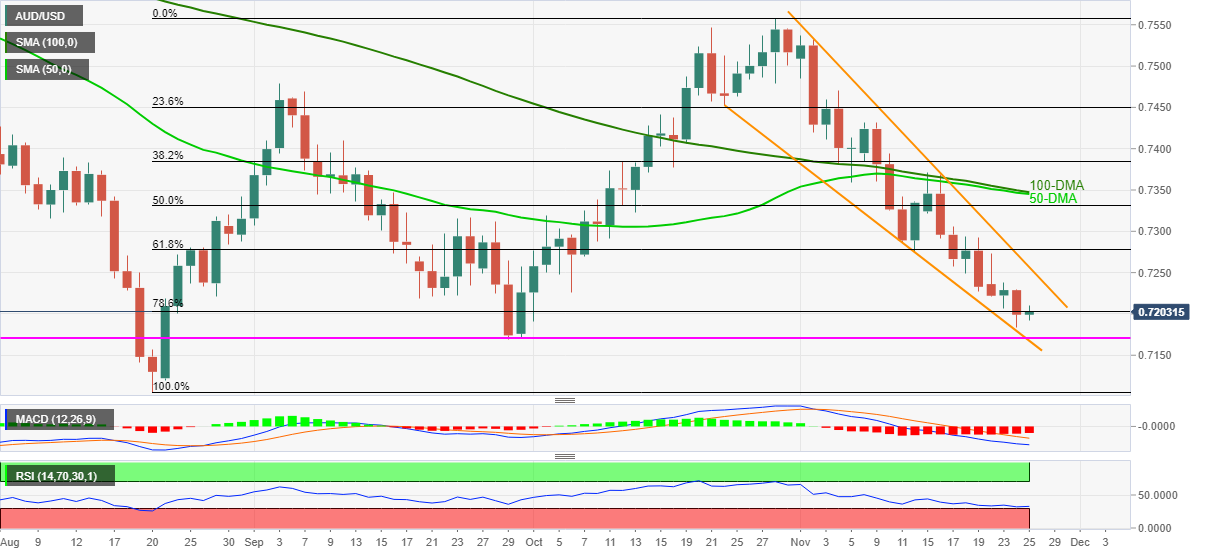
AUD/USD trades flirt with 78.6% % Fibonacci retracement (Fibo.) of August-October upside within a month-long falling wedge bullish formation during early Thursday. That said, the quote retreats from an intraday high 0.7210 while keeping the rebound from a two-month low of 0.7183 by the press time.
Given the oversold RSI conditions, odds favoring the corrective pullback are high, suggesting a U-turn towards the stated pattern’s resistance line near 0.7270.
However, a daily closing past 0.7270 will confirm the theoretical run-up targeting the late June’s high close to 0.7620. During the run-up 61.8% Fibo. and convergence of the key DMAs, respectively around 0.7280 and 0.7350 will precede October’s peak of 0.7557 to challenge the AUD/USD bulls.
Alternatively, further weakness past the 78.6% Fibonacci retracement level of 0.7200 will direct the quote towards September’s monthly bottom of 0.7169. Also challenging the quote is the support line of the stated wedge near 0.7165.
In a case where AUD/USD sellers dominate past 0.7165, the yearly low of 0.7105 should return to the charts.
AUD/USD: Daily chart
Trend: Further recovery expected