USD/CAD Price Analysis: Buyers lurk around monthly support line, 200-SMA
- USD/CAD trims early Asian losses, holds lower ground.
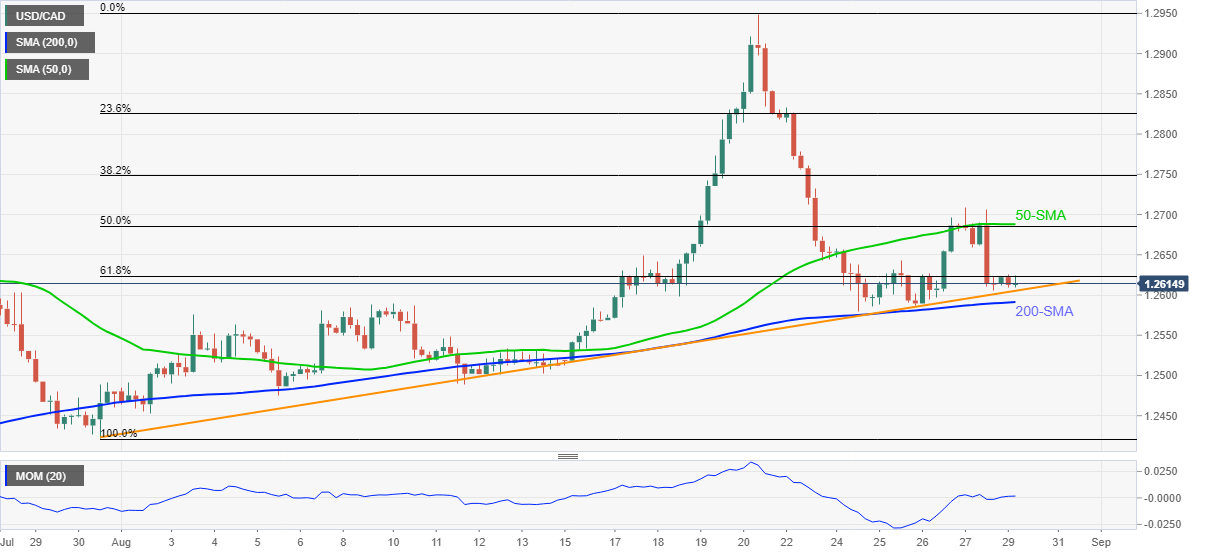
- The key SMA, support line favor bulls but 1.2685–90 become crucial resistance.
- Bears can aim for August 11 low below 200-SMA.
USD/CAD consolidates recent losses of around 1.2620 during a quiet Asian session on Monday.
The Loonie pair dropped heavily on Friday and stayed pressured early in the day but couldn’t break an ascending support line from July 30, not to forget 200-SMA.
Given the firmer Momentum line, the USD/CAD prices are likely to rebound and cross the immediate hurdle, namely 61.8% Fibonacci retracement of July 30 to August 20 upside, near 1.2625.
However, buyers remain skeptical unless crossing a convergence of 50-SMA and 50% Fibonacci retracement level near 1.2685-90.
Alternatively, a downside break of the stated support line and 200-SMA, respectively around 1.2605 and 1.2590, will back the USD/CAD sellers to aim for August 11 bottom surrounding 1.2490.
Should the quote remains pressured below 1.2490, the last month's low near 1.2420 can offer an intermediate halt before recalling the 1.2400 level to the chart.
USD/CAD: Four-hour chart
Trend: Pullback expected