Silver Price Analysis: XAG/USD seems vulnerable, flag breakdown in play ahead of FOMC
- Silver recovered the Asian session dip to weekly lows and climbed to the $26.00 neighbourhood.
- Acceptance below flag pattern favours bearish traders and supports prospects for a further slide.
Silver reversed an early dip to weekly lows and traded in the neutral territory, just below the $26.00 mark heading into the European session.
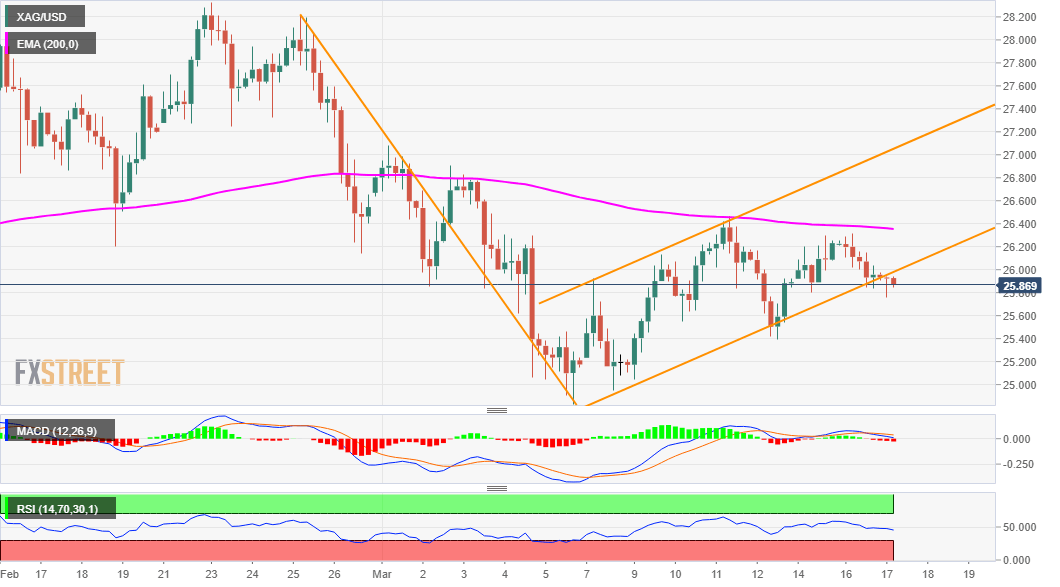
Looking at the technical picture, the XAG/USD already seems to have confirmed a bearish break through a short-term ascending trend-channel support. Given the recent sharp pullback, the channel constituted the formation of a bearish flag pattern on short-term charts.
This comes on the back of repeated failures near the 200-period EMA on the 4-hourly charts and supports prospects for further weakness. The negative outlook is reinforced by the fact that oscillators on the daily chart have just started drifting into the bearish territory.
That said, the lack of any strong follow-through selling warrants some caution before placing aggressive bearish bets. Traders now seemed reluctant, rather preferred to wait on the sidelines ahead of the key event risk – the FOMC monetary policy decision due later this Wednesday.
In the meantime, 100-day SMA, currently around mid-$25.00s is likely to act as immediate strong support. Sustained weakness below will reaffirm the bearish bias and turn the XAG/USD vulnerable to accelerate the fall towards challenging the key $25.00 psychological mark.
A subsequent fall below monthly swing lows, around the $24.85-80 region, will set the stage for an extension of the downward trajectory. The XAG/USD might then slide further towards the very important 200-day SMA support, currently near the $24.40-35 region.
On the flip side, momentum back above the $26.00 mark might continue to confront fresh supply and remain capped near the $26.25-30 region (200-period SMA). Only a convincing break through the mentioned barrier will negate the near-term bearish outlook for the XAG/USD.
XAG/USD 4-hourly chart
Technical levels to watch