USD/CAD Price Analysis: Bears’ shouldn’t ignore falling wedge on 1D
- USD/CAD stays depressed for the fourth consecutive day.
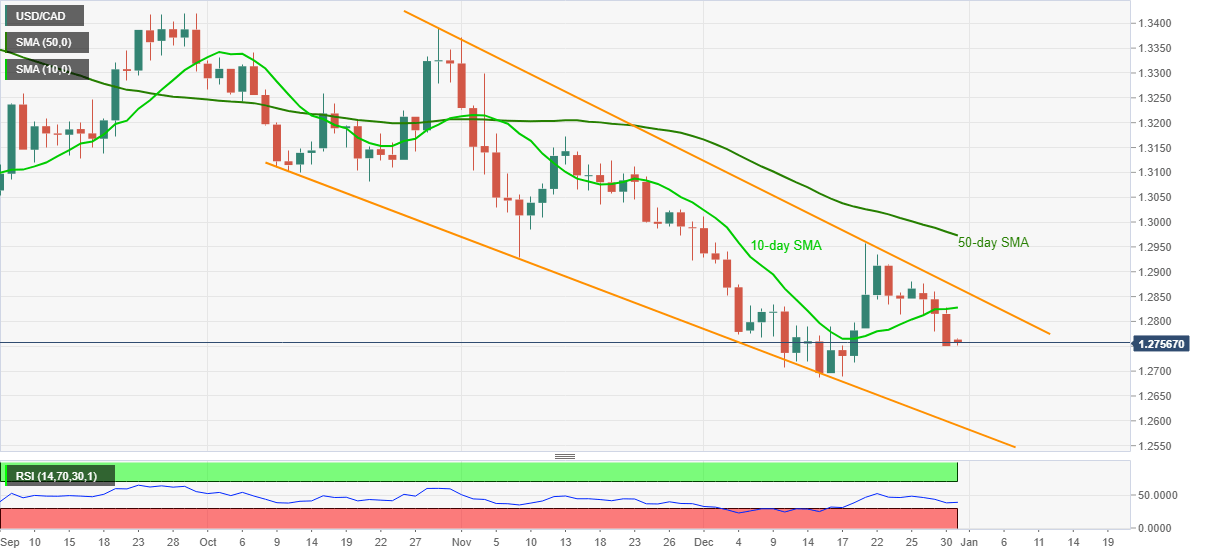
- Sustained downside break of 10-day SMA favors bears targeting fresh low since April 2018.
- 50-day SMA adds to the upside filters beyond the bullish chart pattern.
USD/CAD wavers around the mid-1.2700s while keeping the recent downside momentum during Thursday’s Asian session. The pair dropped below 10-day SMA for the first time in two weeks the previous day.
Although sustained trading below key SMAs and an absence of extreme RSI conditions suggest a continuation of the present downtrend, sellers have limited scope below the April 2018 lows inside the bullish formation.
That said, two bounces off 1.2688, the multi-month low flashed before two weeks, are on the USD/CAD sellers’ radar at the moment. Though, any further downside will be challenged by the lower line of the stated pattern near 1.2590.
Meanwhile, an upside clearance of 10-day SMA, at 1.2827 now, will eye to confirm the stated bullish pattern with a break above the 1.2870 resistance line.
Although a successful move past-1.2870 theoretically indicates a gradual run-up beyond 1.3500, 50-day SMA near 1.2970, the 1.3000 theshold and multiple tops below 1.3400 can challenge the bulls during the rise.
USD/CAD daily chart
Trend: Pullback expected