USD/CAD Price Analysis: Path of least resistance appears to the downside
- USD/CAD’s recovery capped below 1.3100 so far this Friday.
- Hourly technical set up remains in favor of the bears.
- Eyes on global market sentiment and Canadian data for fresh impulse.
USD/CAD has stalled its recovery from Thursday’s low of 1.3062, as a bunch of healthy resistance levels is stacked up, making it difficult for the bulls to fight back control.
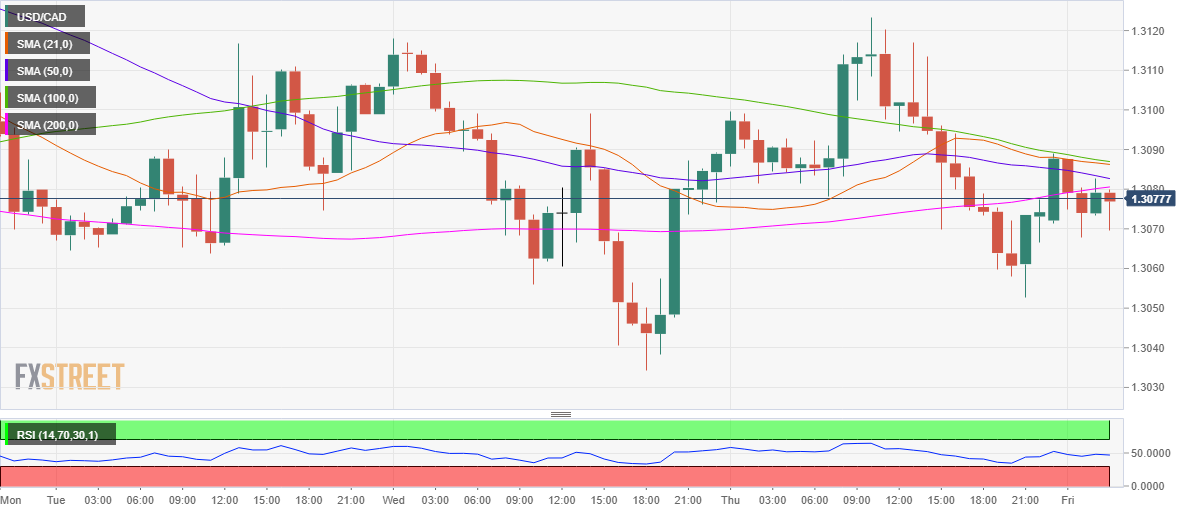
The hourly chart shows that the recovery lost legs at 1.3088, the convergence of the bearish 21 and 100-hourly moving averages (HMA).
Following the rejection at that hurdle, the price slipped below the 50-HMA and 200-HMA support levels, calling for additional downside.
The hourly Relative Strength Index (RSI) languishes just below the 50 level, suggesting that the bearish bias remains intact.
Therefore, a test of Thursday’s low cannot be ruled out should the selling pressure accelerate.
The next downside target awaits at 1.3034, Wednesday’s low.
On the flip side, 1.3085 offers immediate resistance. That level is the meeting point of the 50 and 200-HMA now.
Meanwhile, the abovementioned barrier at 1.3088 is the level to beat for the bulls.
USD/CAD: Hourly chart
USD/CAD: Additional levels