Gold Price Analysis: Bulls are monitoring for bullish extension
- Gold bulls are in charge at the start of the and a break of resistance opens bullish prospects.
- The price is currently trapped below hourly resistance and above key support.
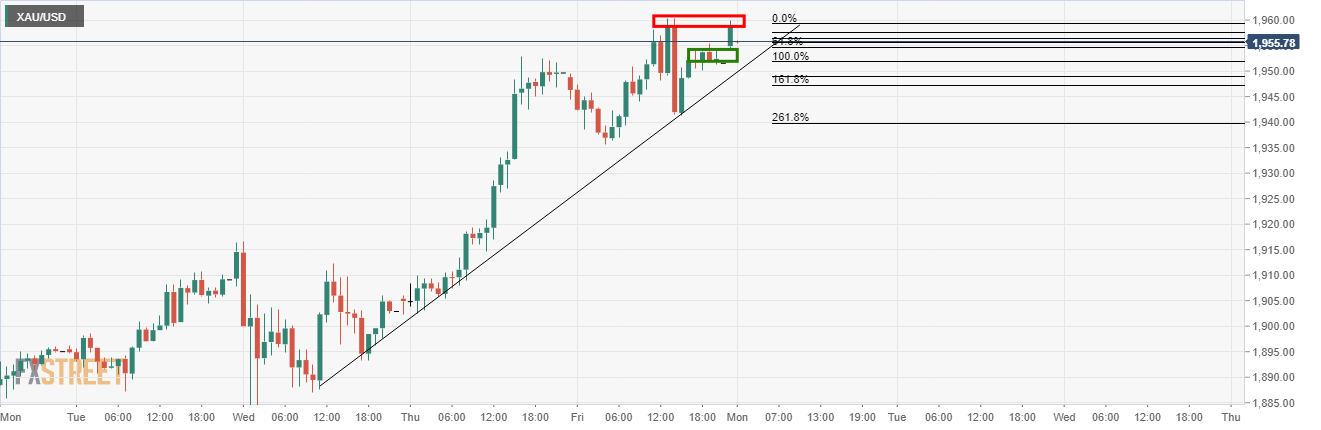
The price of gold has kicked off the week on the front and from an hourly perspective, but it is priming for a bullish opportunity above a key support structure.
However, there is work to do yet.
The price started the day popping from a low of $1,951.19 tally up bids all the way to $1,959.90 before a significant set-back to $1,952.73.
The price is currently holding at a critical support level.
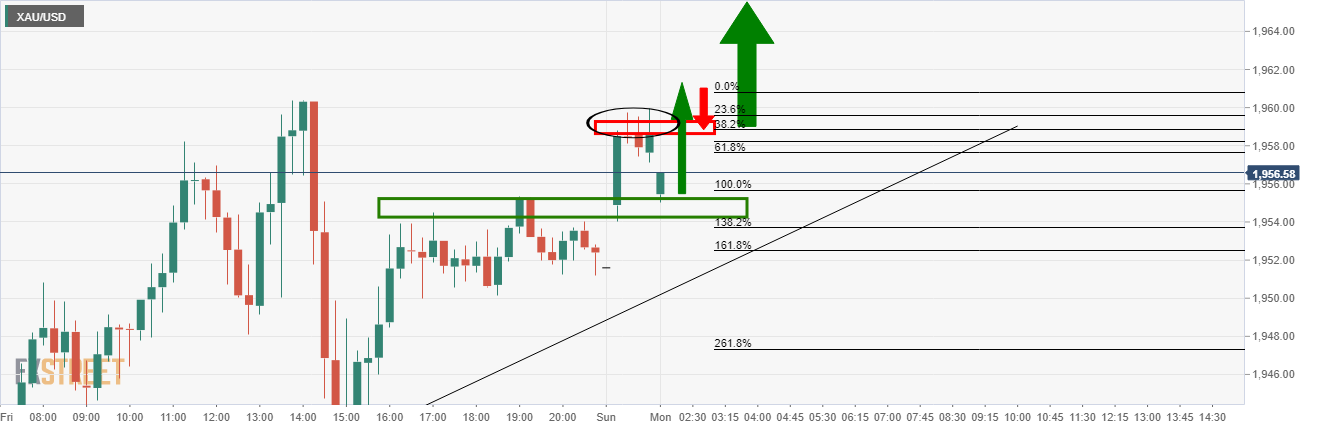
The price has reached a 61.8% Fibonacci retracement of the bullish impulse on the hourly chart, meeting support structure with the wicks to the 78.6% Fibo and subsequent rejection.
However, while there has been deceleration since the sharp price drop, the highs offer too much rigidness from a 15-min time frame perspective.
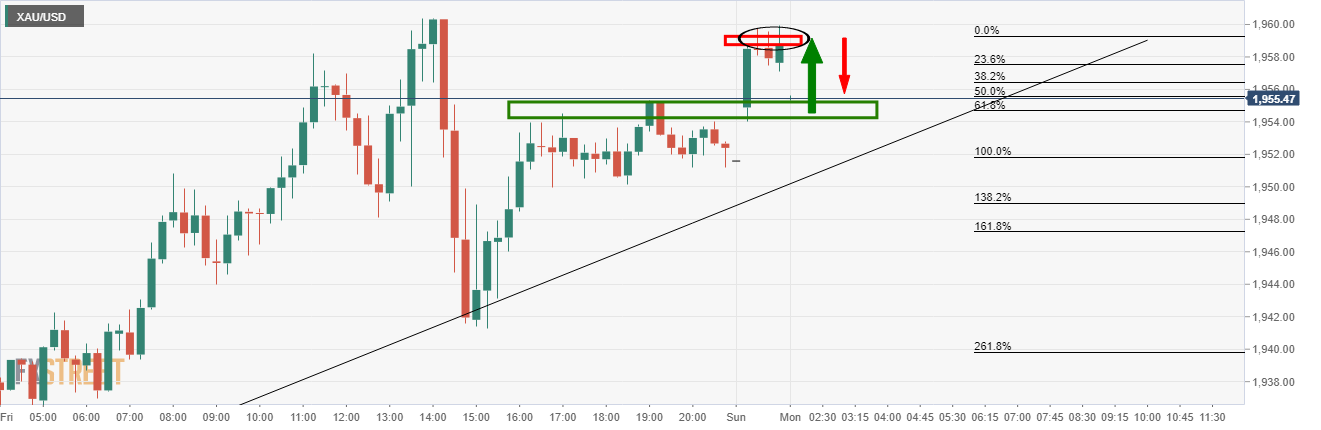
For better probabilities, bulls will want to see a break of the current hourly resistance and rely on a discount from the structure that would be expected to act as support on a healthy Fibonacci retracement.
For a longer-term analysis based on the monthly, weekly and daily charts, see below: