GBP/USD Price Analysis: Penetrates support at 1.3083
- GBP/USD reverses lower from a Fibonacci retracement hurdle.
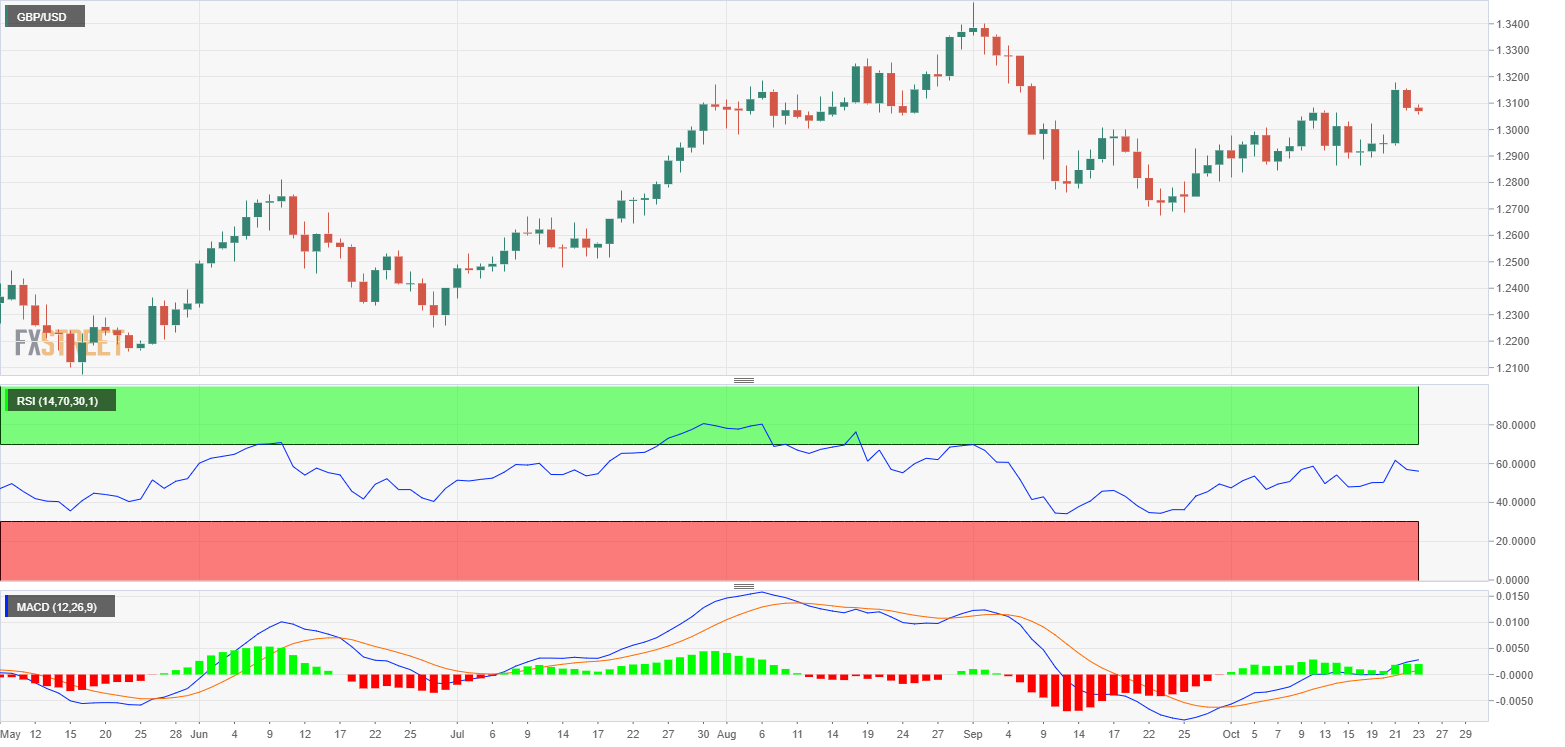
- Daily chart indicators continue to favor the bullish move.
GBP/USD has breached the support at 1.3083 (Oct. 12 high), extending Thursday's 0.48% decline.
The pair failed to take out 1.3174 – the 61.8% Fibonacci retracement of the drop from Sept. 1 high to Sept. 23 low – earlier this week and has been on the offer ever since.
However, the 14-day relative strength index is still holding above 50 (in bullish territory). Similarly, the positive MACD histogram shows the path of least resistance is to the higher side.
As such, the pair could reverse losses during the day ahead. On the way higher, the pair may encounter resistance at 1.3174, followed by 1.3267 (Aug. 19 high).
On the downside, support is seen at 1.3011 (50-day simple moving average). At press time, the pair is trading at 1.3068.
Daily chart
Trend: Neutral-to-bullish