GBP/USD Price Analysis: Bull pennant breakout, golden cross on 1H chart point to more gains
- GBP/USD eyes a break above 1.3200 amid Brexit optimism.
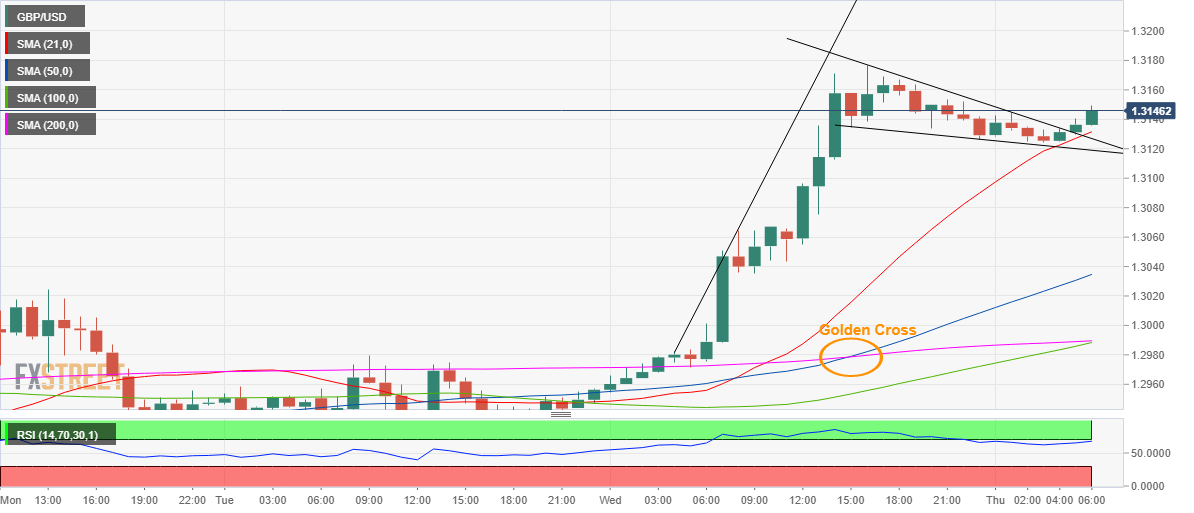
- Bull pennant and golden cross confirmed on the hourly chart.
- Hourly RSI stays bullish still below the overbought region.
Amid the resumption of the Brexit negotiations officially and hopes of a potential deal by mid-November, GBP/USD rallied hard on Wednesday.
The spot hit fresh six-week highs of 1.3178 before correcting towards 1.3100 this Friday. At the press time, the cable trades flat at 1.3143, poised for a fresh rally towards the 1.3200 level and beyond amid a bullish technical setup.
The major has confirmed a bull pennant breakout as well as a golden cross on the hourly sticks, opening doors for a test of levels above 1.3300.
On its journey northwards, the GBP bulls could face an initial hurdle at Wednesday’s high of 1.3178, above which the psychological 1.3200 magnate could be put to test.
The hourly Relative Strength Index (RSI) remains in the bullish area at 66.67, allowing for additional upside.
On the flip side, the upward-sloping 21-hourly moving average (HMA) at 1.3131 is likely to offer immediate support.
The pattern will likely get invalidated should the price close below the falling trendline support at 1.3119 on an hourly basis. The next downside support is aligned at the 50-HMA of 1.3034.
All in all, the path of least resistance is to the upside.
GBP/USD: Hourly chart
GBP/USD: Additional levels