24 Mar 2020
US Dollar Index Price Analysis: Further correction could extend to 100.00
- DXY’s upside stalled just pips away of the 103.00 mark.
- Further downside seen re-testing the 100.00 neighbourhood.
DXY has resumed the downside and recedes further from the area of yearly highs in the 103.00 region.
If the selling impetus picks up pace, the 100.00 area could be revisited. This zone of contention is also reinforced by a Fibo retracement (of the 2017-2018 drop) at 100.49.
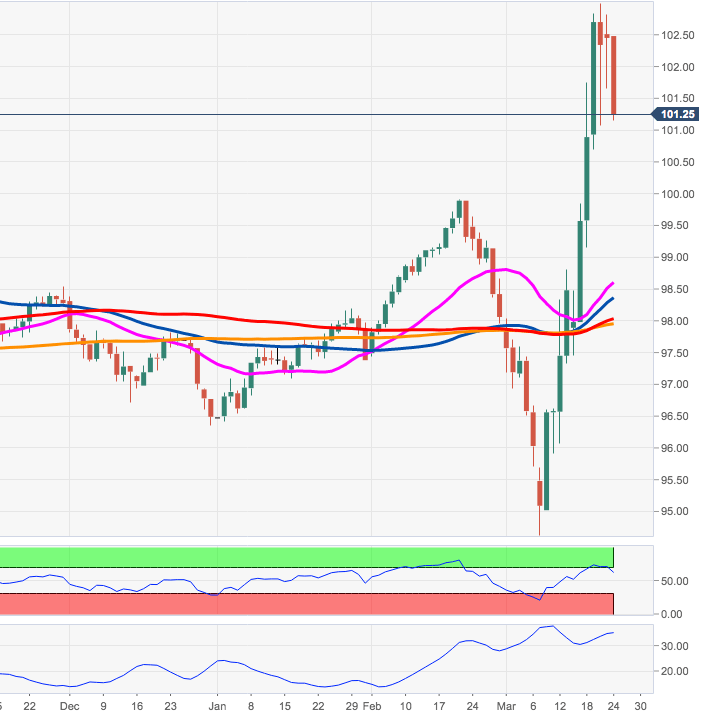
On the broader view, the 200-day SMA, today at 97.94, keeps underpinning the constructive outlook.
DXY daily chart