28 Nov 2019
USD/INR charts three-day losing streak, nears 50-day MA support
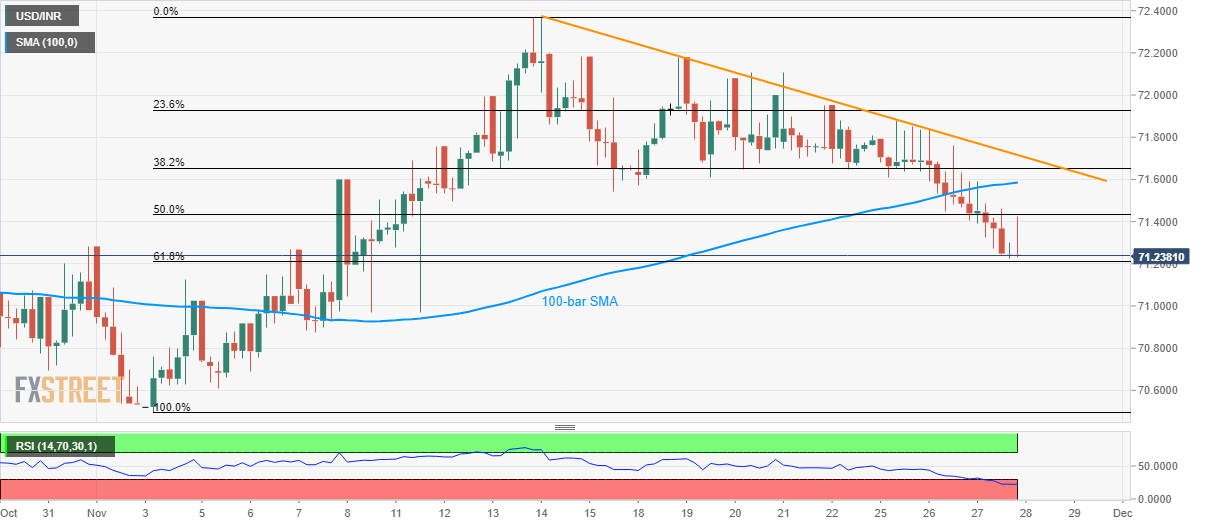
USD/INR Technical Analysis: Oversold RSI conditions signal pullback from 61.8% Fibo.
Following its sustained trading below 100-bar Simple Moving Average (SMA), USD/INR declines to 71.24 by the press time of Thursday’s early Asian session. The quote nears 61.8% Fibonacci retracement of the current month rise while the 14-bar Relative Strength Index (RSI) indicate oversold conditions. Read more ...
USD/INR charts three-day losing streak, nears 50-day MA support
USD/INR fell 0.31% on Wednesday, confirming a three-day losing streak, the longest since Oct. 23. The Rupee extended Tuesday's rally amid trade optimism and weakness in crude oil – Brent's front-month contract fell more than 1.6% to $62.48 per barrel. Read more ...