11 Nov 2019
US Dollar Index technical analysis: DXY taking a breather on Monday, holding above the 98.00 handle
- DXY is consolidating last week’s advance below the 50 DMA.
- The level to beat for bulls is the 98.40 resistance level.
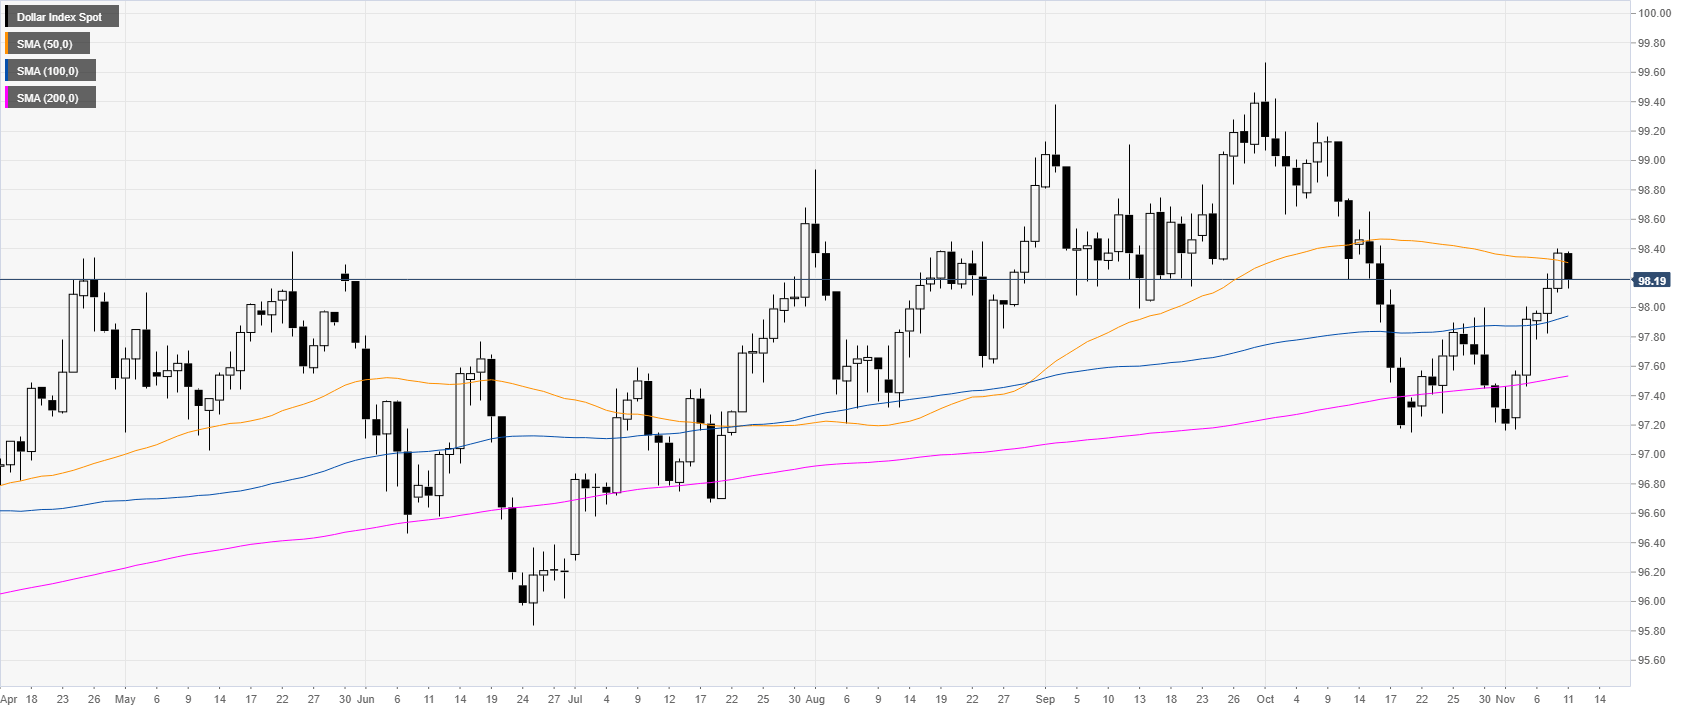
DXY daily chart
DXY (US Dollar Index) is trading in a bull trend above the main daily simple moving average (DMAs). This Monday the Greenback is retracing down from the 98.40 level and the 50 DMA.
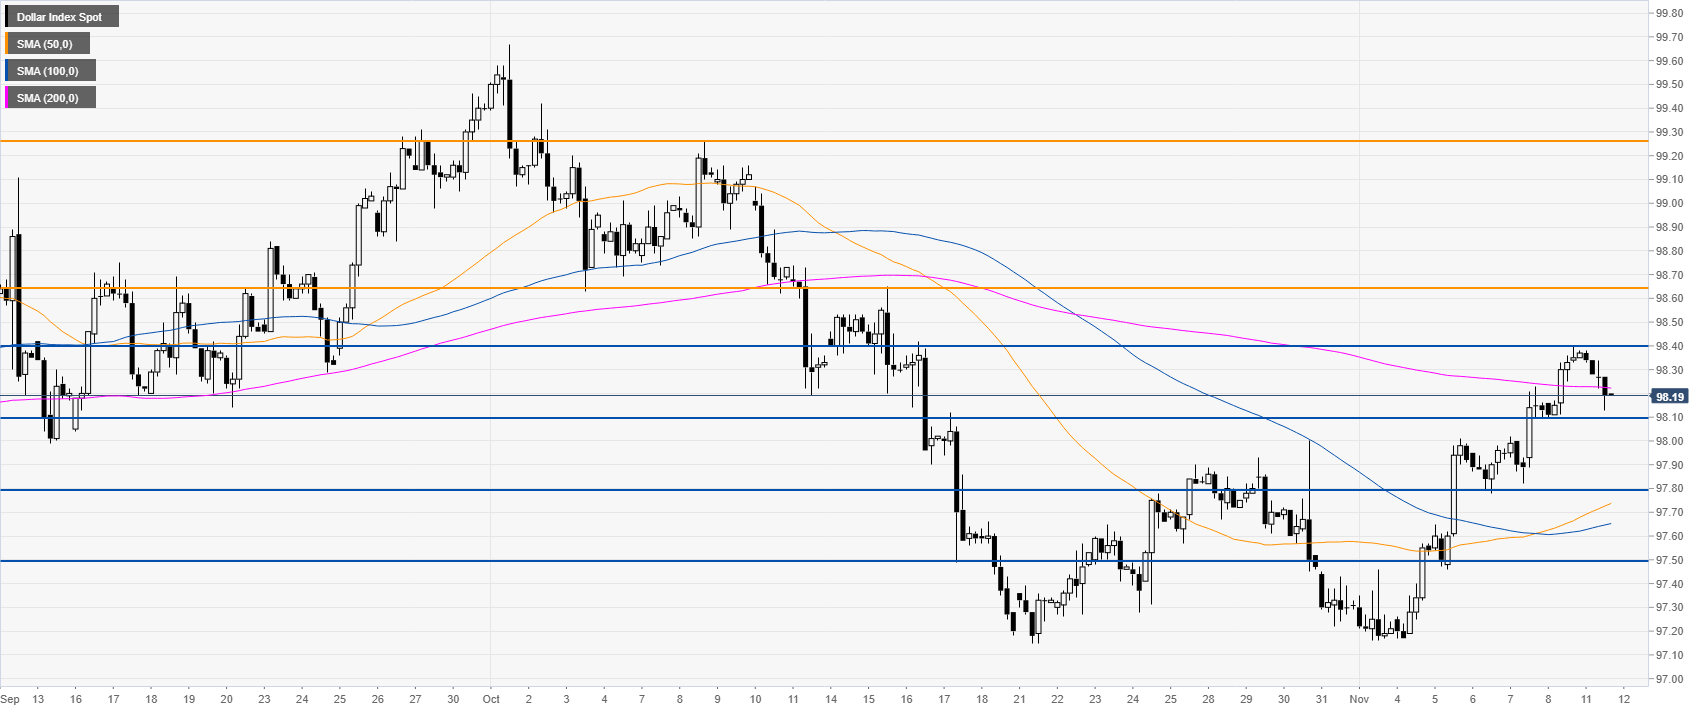
DXY 4-hour chart
DXY is consolidating the recent gains, trading above the 50 and 100 SMAs while coiling near the 200 SMA. The buyers will likely be looking for a break above the 98.40 resistance level to reach the 98.65 and the 99.26 resistances on the way up.
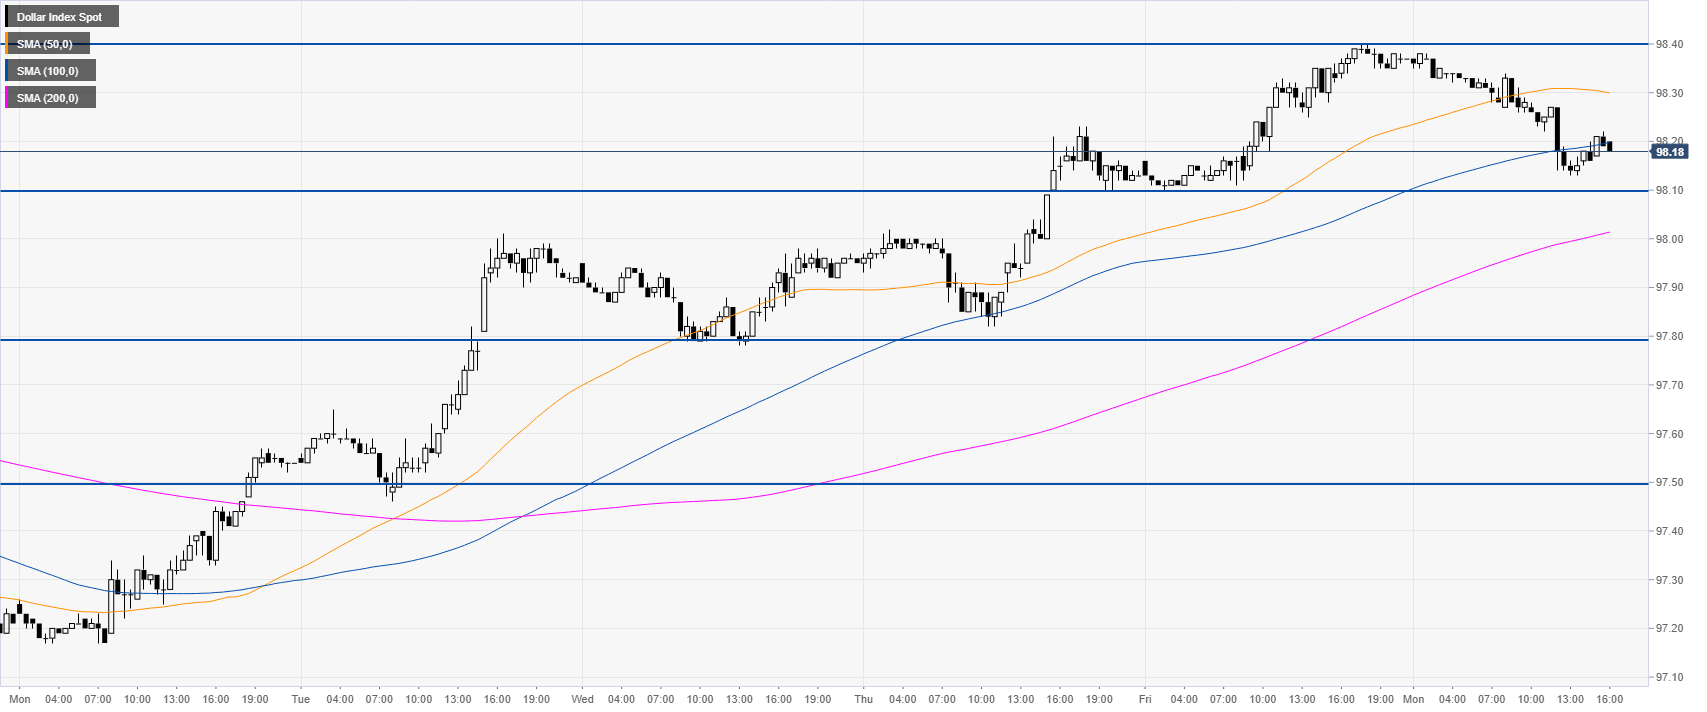
DXY 30-minute chart
DXY is trading below the 50 and 100 SMAs, suggesting a consolidation down in the short term. Support is seen at the 98.10, 97.80 and 97.50 price levels.
Additional key levels