4 Nov 2019
GBP/USD technical analysis: Cable challenging 1.2900 handle, drifting down in the New York session
- GBP/USD is losing steam at the start of the week.
- The level to beat for sellers is the 1.2906 support.
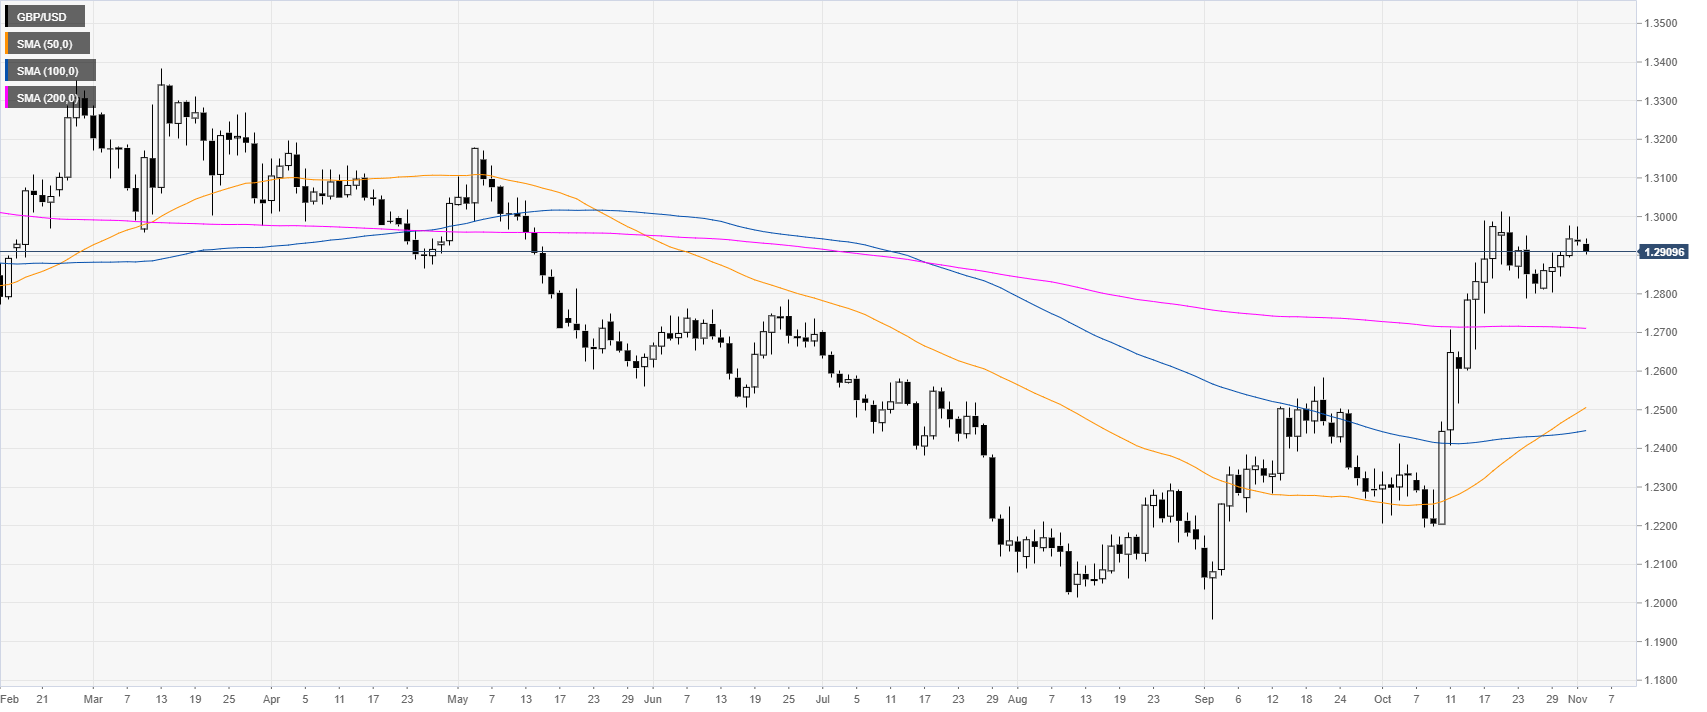
GBP/USD daily chart
In October, the Cable skyrocketed above the main daily simple moving averages (DMAs) and hit levels not seen since mid-May 2019. Bulls need a daily close above the 1.3000 figure and the October high at the 1.3013 level.
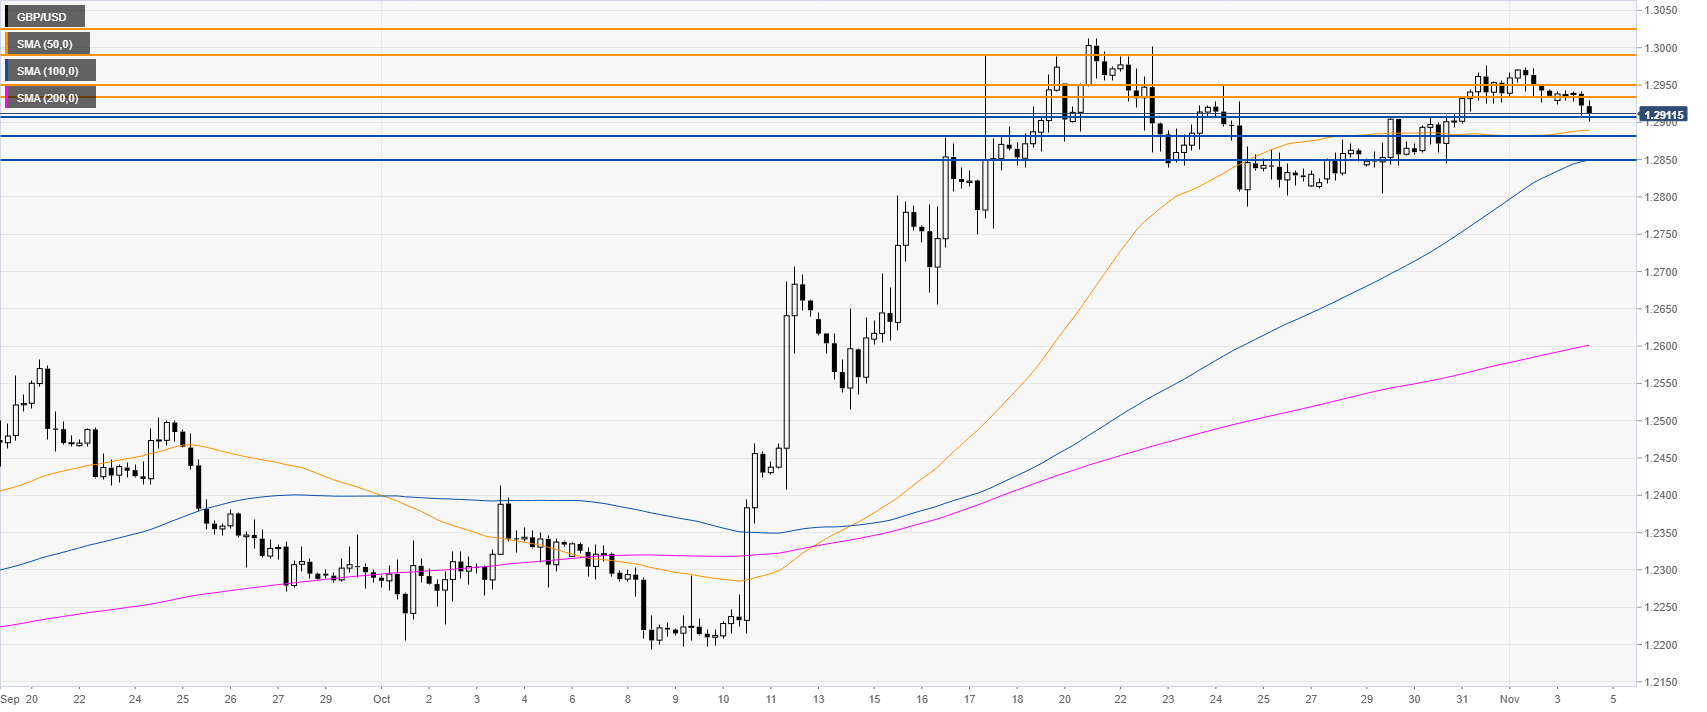
GBP/USD four-hour chart
GBP/USD is trading above the 1.2900 figure and its main SMAs on the four-hour chart, suggesting a bullish bias in the medium term. However, the market formed a double top with the October highs. For buyers, a break of the 1.2989 resistance is necessary to open the doors to gains towards the 1.3024 level and the 1.3100 handle.
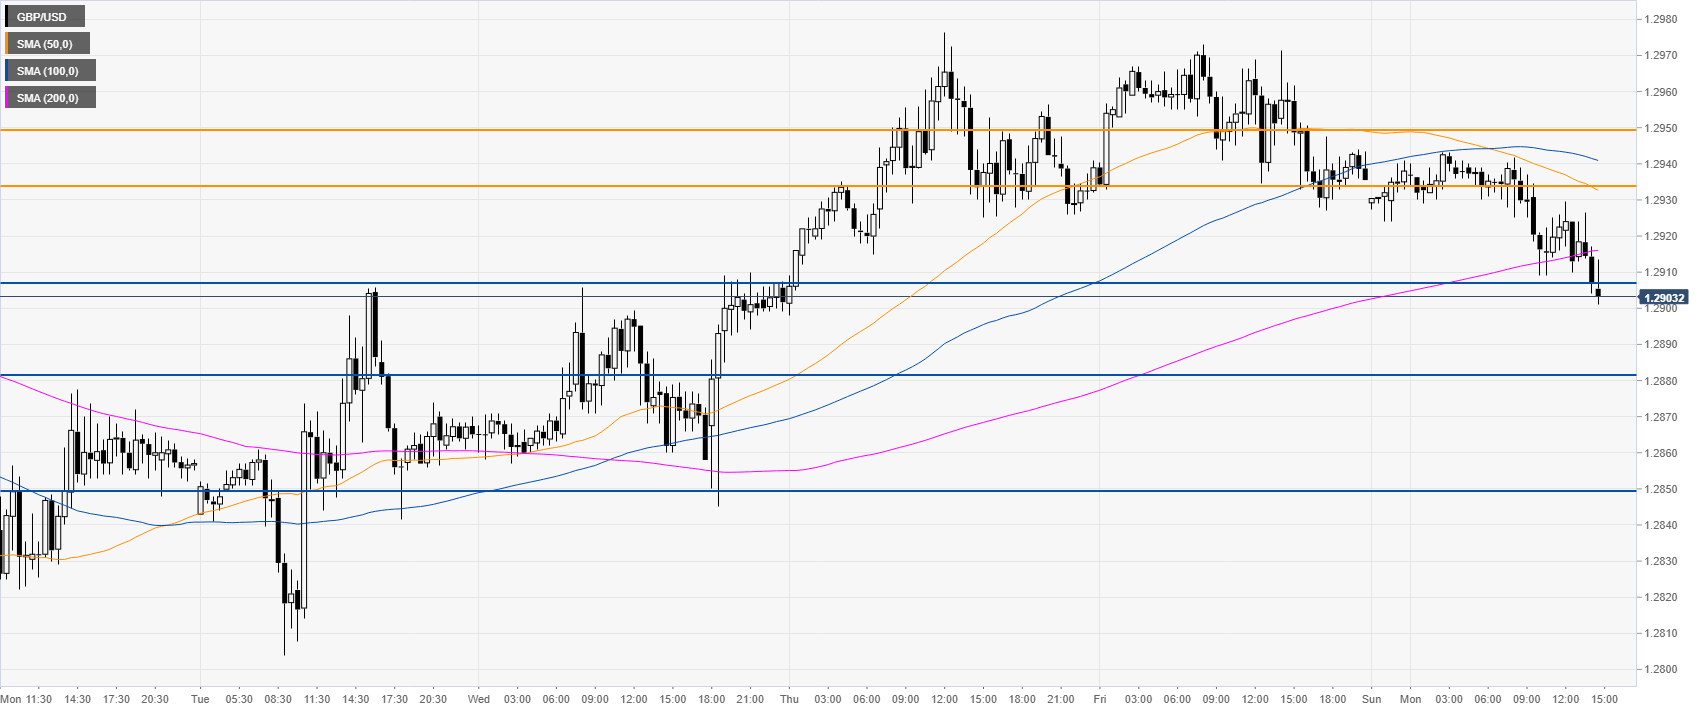
GBP/USD 30-minute chart
Sterling/Dollar is trading at daily lows while challenging the 1.2906 support level. A clear break below the level can open the doors to further weakness towards the 1.2880 and 1.2850 support levels, according to the Technical Confluences Indicator.
Additional key levels