1 Nov 2019
US Dollar technical analysis: DXY remains under pressure at multi-month lows
- The US Dollar Index (DXY) remains under heavy pressure on the first day of November.
- The market is challenging 97.20 support. Further weakness to the 97.00 handle can be expected below this level.
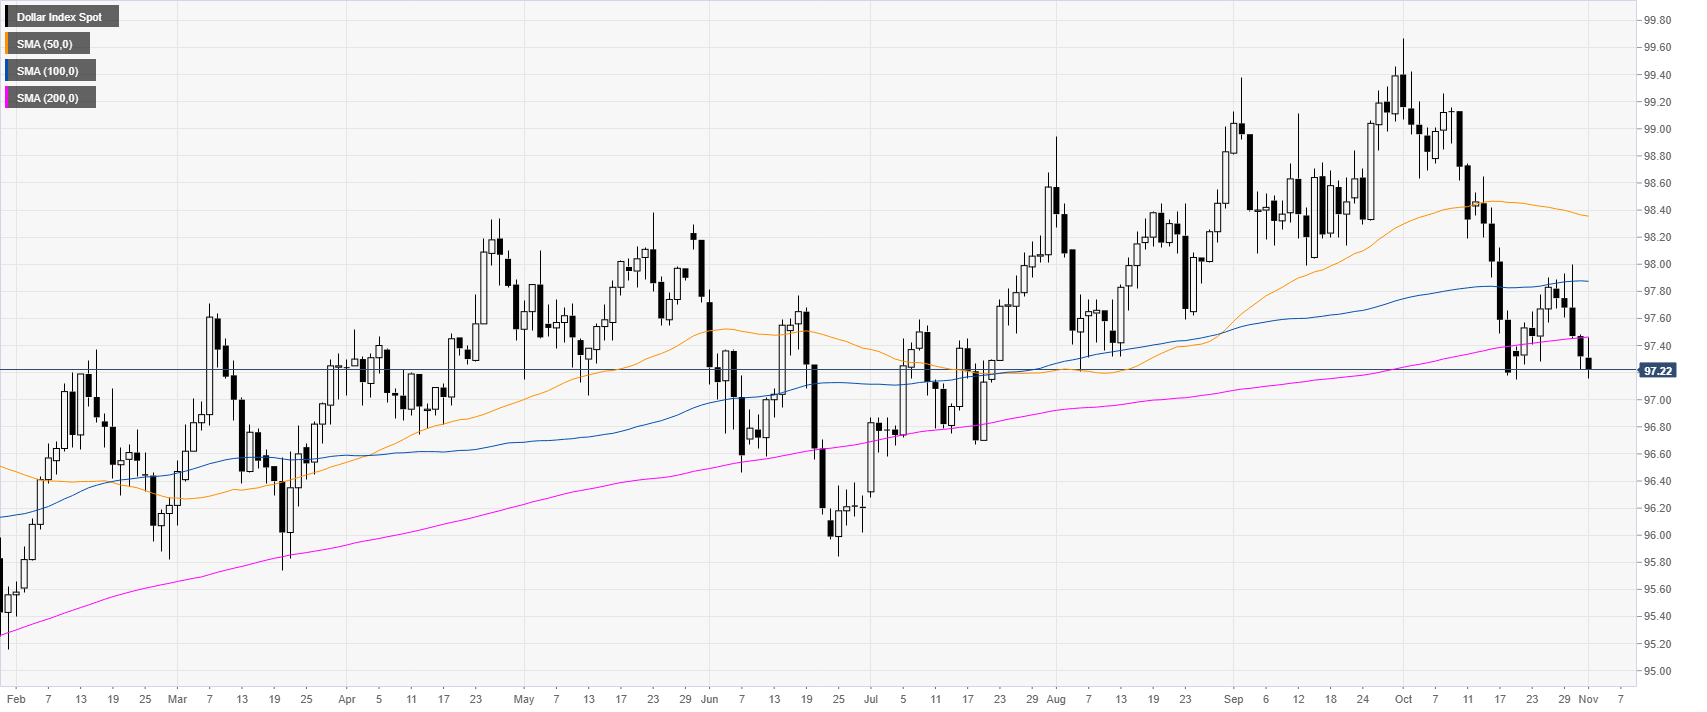
DXY daily chart
The US Dollar Index (DXY) is trading below its main daily simple moving averages (DMAs) after a dramatic drop in October.
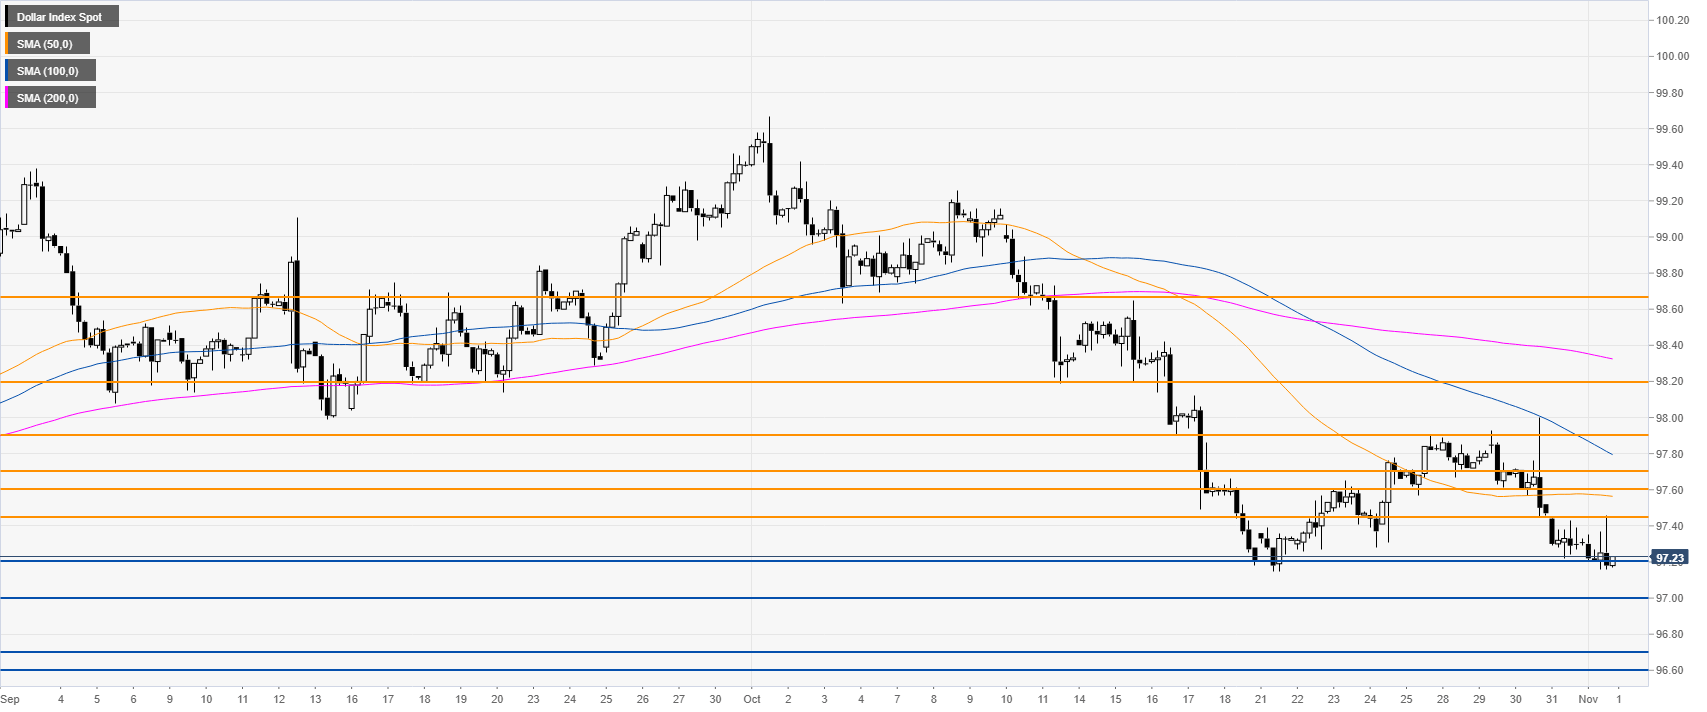
DXY four-hour chart
On the four-hour chart, the Greenback is trading below its main SMAs, suggesting bearish momentum in the medium term. A break below 97.20 can lead to the 97.00 handle and the 96.70/60 support zone.
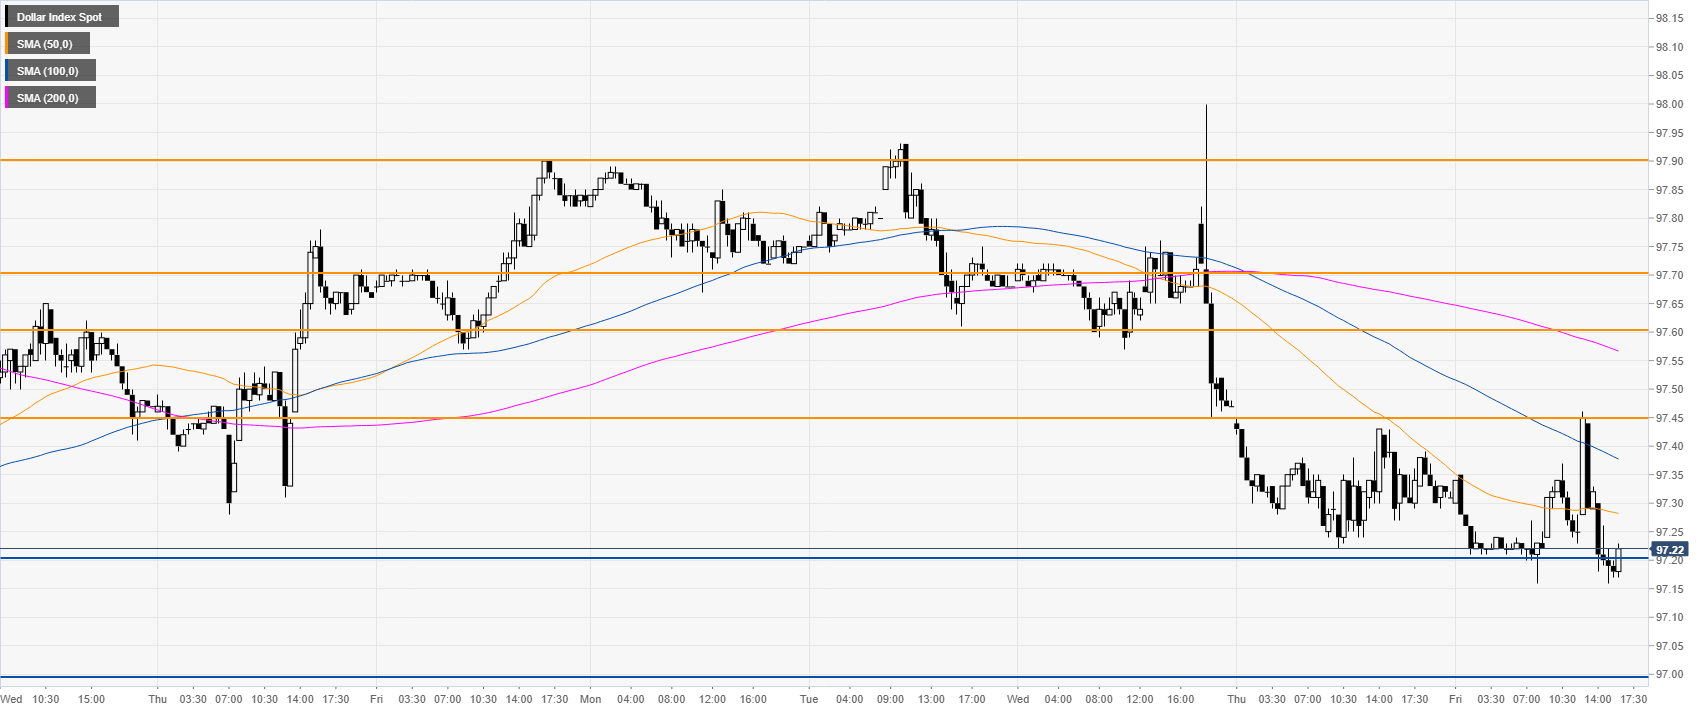
DXY 30-minute chart
DXY is trading below its main SMAs, suggesting a bearish bias in the near term. Resistance is seen at the 97.45 and 97.60 price levels.