27 Sep 2019
USD/IDR technical analysis: Sellers keep lurking around 50% Fibo.
- USD/IDR again reverses from 50% Fibonacci retracement.
- A two-week-old rising trend-line, upbeat RSI portrays pair’s strength.
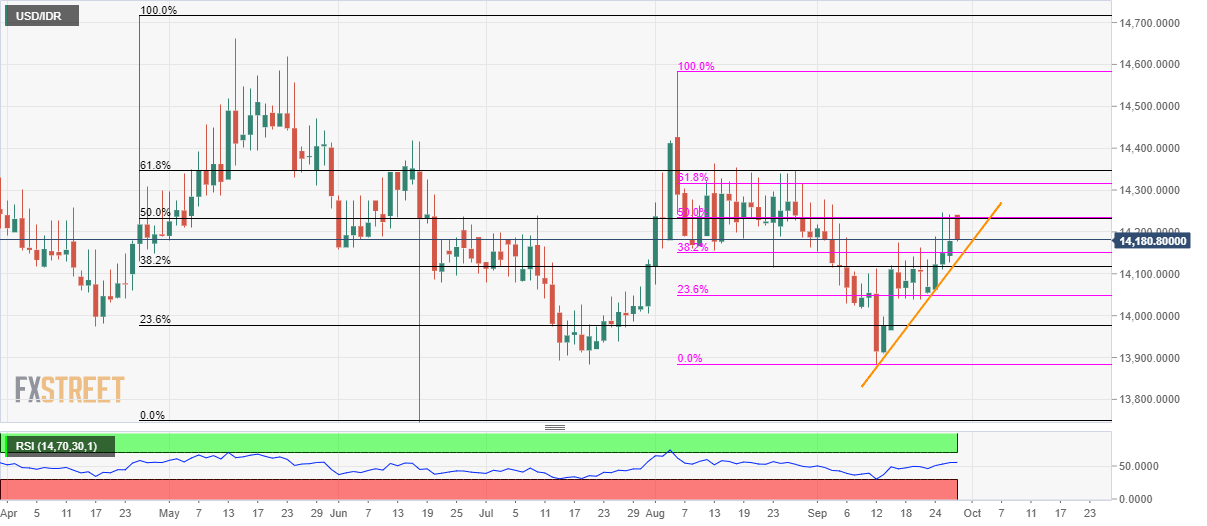
Be it April-June downpour or August-September declines, USD/IDR keeps retracing from 50% Fibonacci retracement level while taking rounds to 14,180 during early Friday.
While repeated failures to clear key Fibonacci retracement increases the odds of the pair’s pullback, an upward sloping trend-line since September 12, at 14,130, and strong levels of 14-day relative strength index (RSI) could challenge sellers.
If bears dominate below 14,130, multiple rest-points around 14,040 and 14,000 round-figure can entertain them ahead of highlighting 13,880 support.
Alternatively, pair’s successful rise beyond 14,235/40 area including the key Fibonacci retracements can please buyers with 14,350 and 14,420 resistances.
USD/IDR daily chart
Trend: pullback expected