USD/CHF technical analysis: 1-week-old resistance-line, 23.6% Fibo. limits nearby upside
- USD/CHF pulls back from a multi-day high, stays above 200-bar SMA.
- Trend-positive RSI increases the odds of upside.
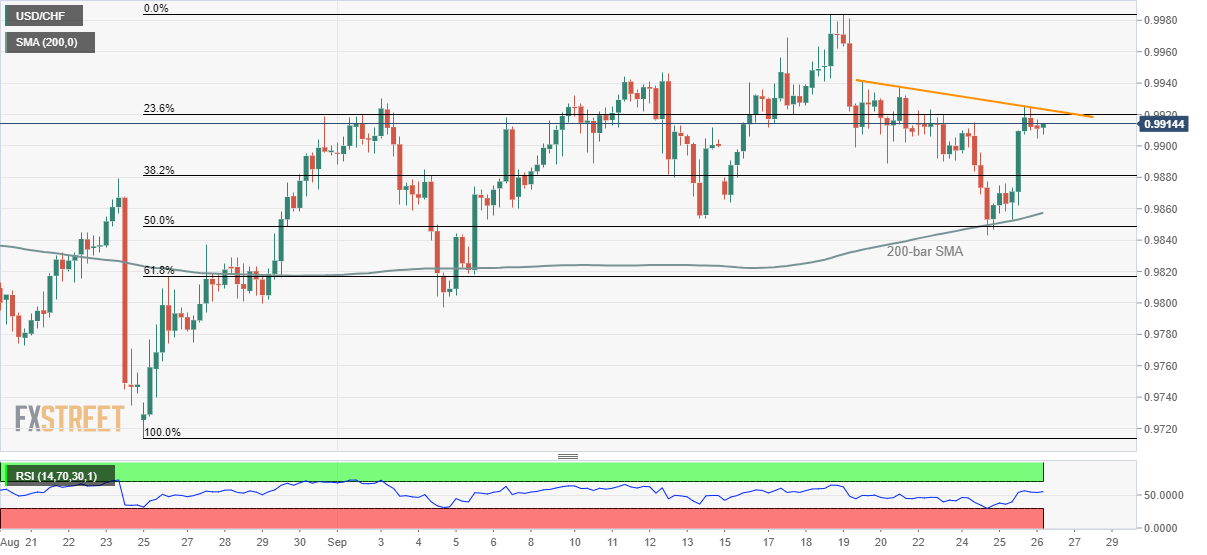
Despite bouncing off 200-bar simple moving average (SMA), USD/CHF fails to cross near-term key resistances as it trades around 0.9915 while heading into the European session open on Thursday.
With this, the quote can witness pullback to 38.2% Fibonacci retracement of August-September upside, at 0.9880, ahead of highlighting the key 200-bar SMA level of 0.9855 for one more time.
If bears dominate past-0.9855, pair’s downpour to 0.9800 can’t be denied.
It should also be noted that 14-br relative strength index (RSI) supports the pair's gradual upside by being near to 50 levels.
Alternatively, an upside clearance of 0.9920/25 area including one-week-old falling trend-line and 23.6% Fibonacci retracement can trigger fresh run-up to 0.995 and then to recent highs surrounding 0.9980.
However, 1.0000 psychological magnet could challenge bulls afterward.
USD/CHF 4-hour chart
Trend: pullback expected