USD/IDR technical analysis: 3-week-old support-line restricts declines below 200-bar SMA
- USD/IDR trades below 200-bar SMA for the first-time since July-end.
- Near-term falling trend-line, weak RSI conditions limit pair’s downside.
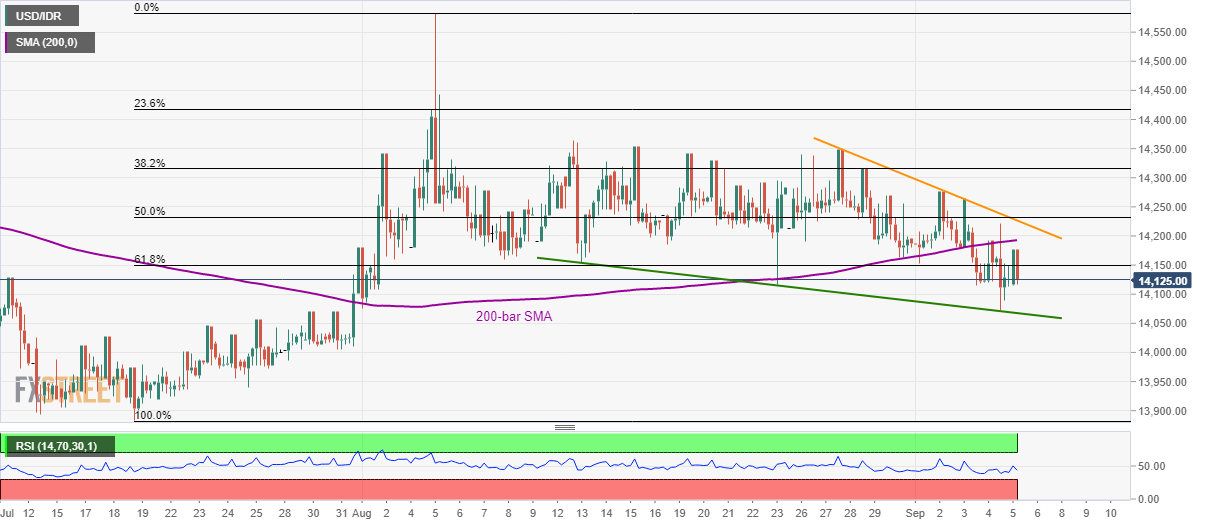
USD/IDR fails to extend downside momentum below the 200-bar simple moving average (SMA) as immediate support-line questions sellers as the pair takes the rounds to 14,120 during Friday’s Asian session.
Not only a downward-sloping trend-line since August 13 but weak conditions of 14-bar relative strength index (RSI) raise bars for the pair’s declines under 14,065.
In a case prices slip below 14,065, 14,000 and July 25 low near 14,940 can act as buffers during the quote’s drop to July month low near 13,880.
Meanwhile, pair’s upside past-200-bar SMA level of 14,192 won’t be a sure bullish signal as a declining trend-line since early last-week and 50% Fibonacci retracement of late-July to early-August rise, close to 14,230, will stop buyers.
Should there be further upside beyond 14,230, multiple resistances around 14,350/60 and 23.6% Fibonacci retracement of 14,420 could hinder the path towards August top surrounding 14,582.
USD/IDR 4-hour chart
Trend: sideways