EUR/USD technical analysis: Sellers aim for 2-month old support-line during further declines
- EUR/USD seesaws near mid-May 2017 lows.
- Bearish MACD signals further downside towards near-term key support-line.
EUR/USD extends its downpour as its trades close to the lowest since May 2017 while flashing 1.0965 during Tuesday’s Asian session.
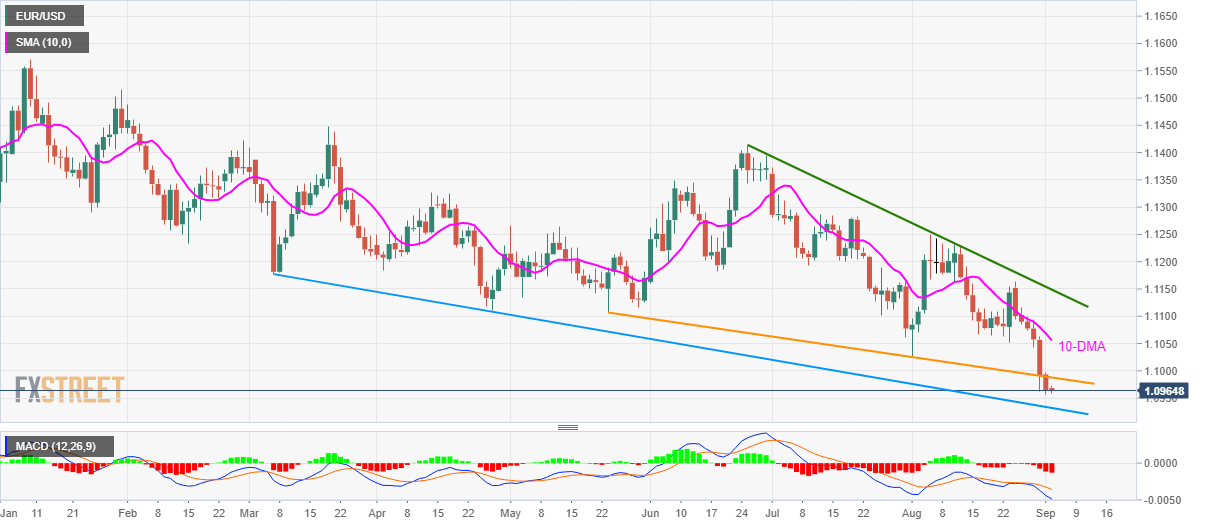
12-bar moving average convergence and divergence (MACD) keeps signaling pair’s further south-run. Though, a two-month-old falling trend-line, at 1.0932, could trigger the pullback, if not then 1.0900 can offer an intermediate halt before the quote plunges to fill the gap of April 2017, around 1.0780.
Alternatively, the support-turned-resistance line stretched since late-May 2019, at 1.0988, becomes an immediate upside barrier to watch ahead of August 01 low of 1.1027 and 10-day simple moving average (DMA) level of 1.1056.
During the pair’s run-up beyond 1.1056, a downward sloping trend-line since late-June, around 1.1150, will be the key to follow.
EUR/USD daily chart
Trend: bearish