14 Jun 2019
GBP/USD technical analysis: Cable keep sliding to 9-day lows below 1.2600 handle
- GBP/USD is under strong selling pressure as the USD is on the rise.
- The market is nearing the May low near 1.2559 which is an important support to look at.
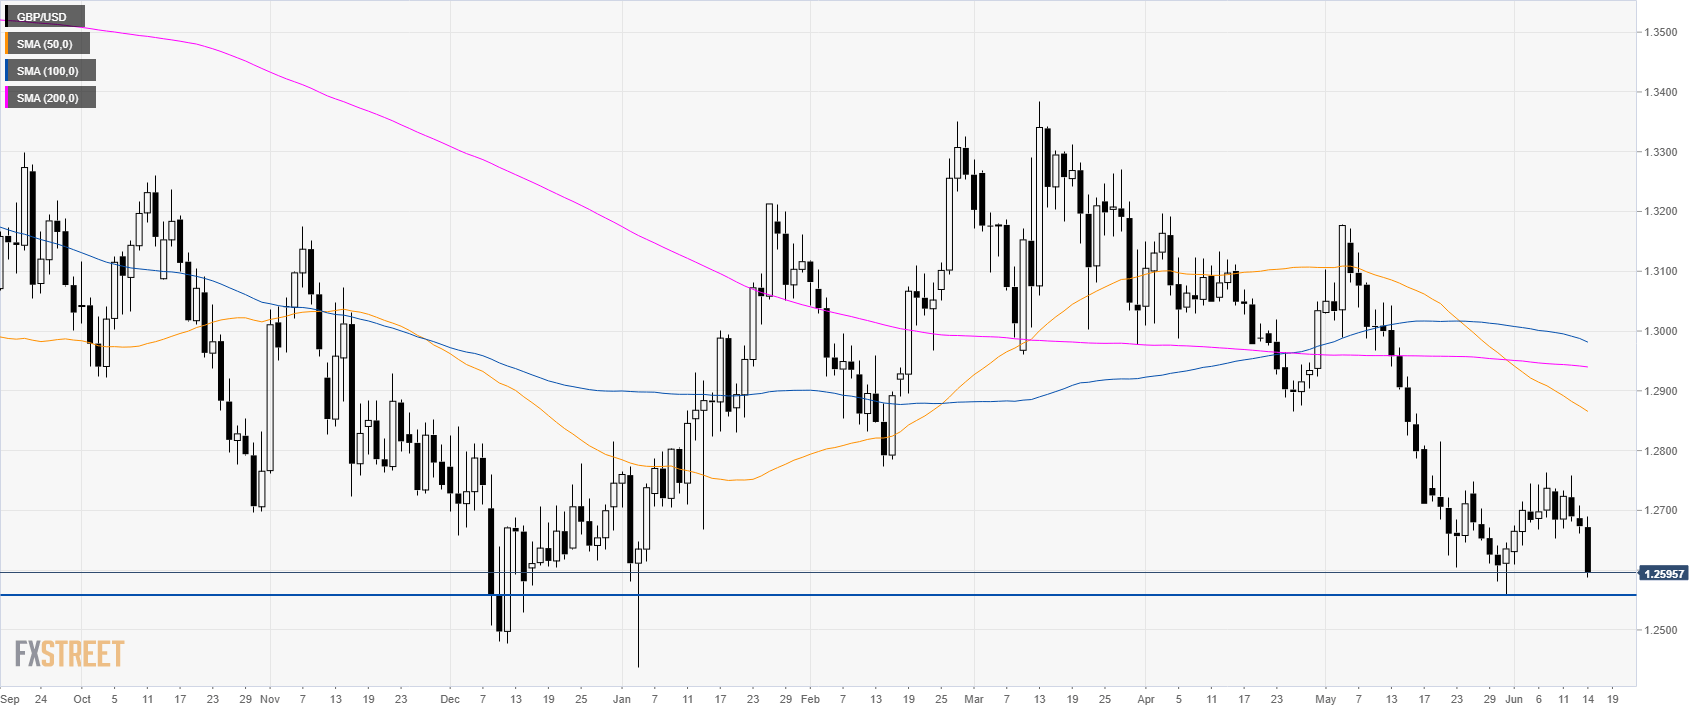
GBP/USD daily chart
GBP/USD is trading in a bear trend below its main simple moving averages. The market is nearing the May low at 1.2559. It will be interesting to see if the market will break this support.
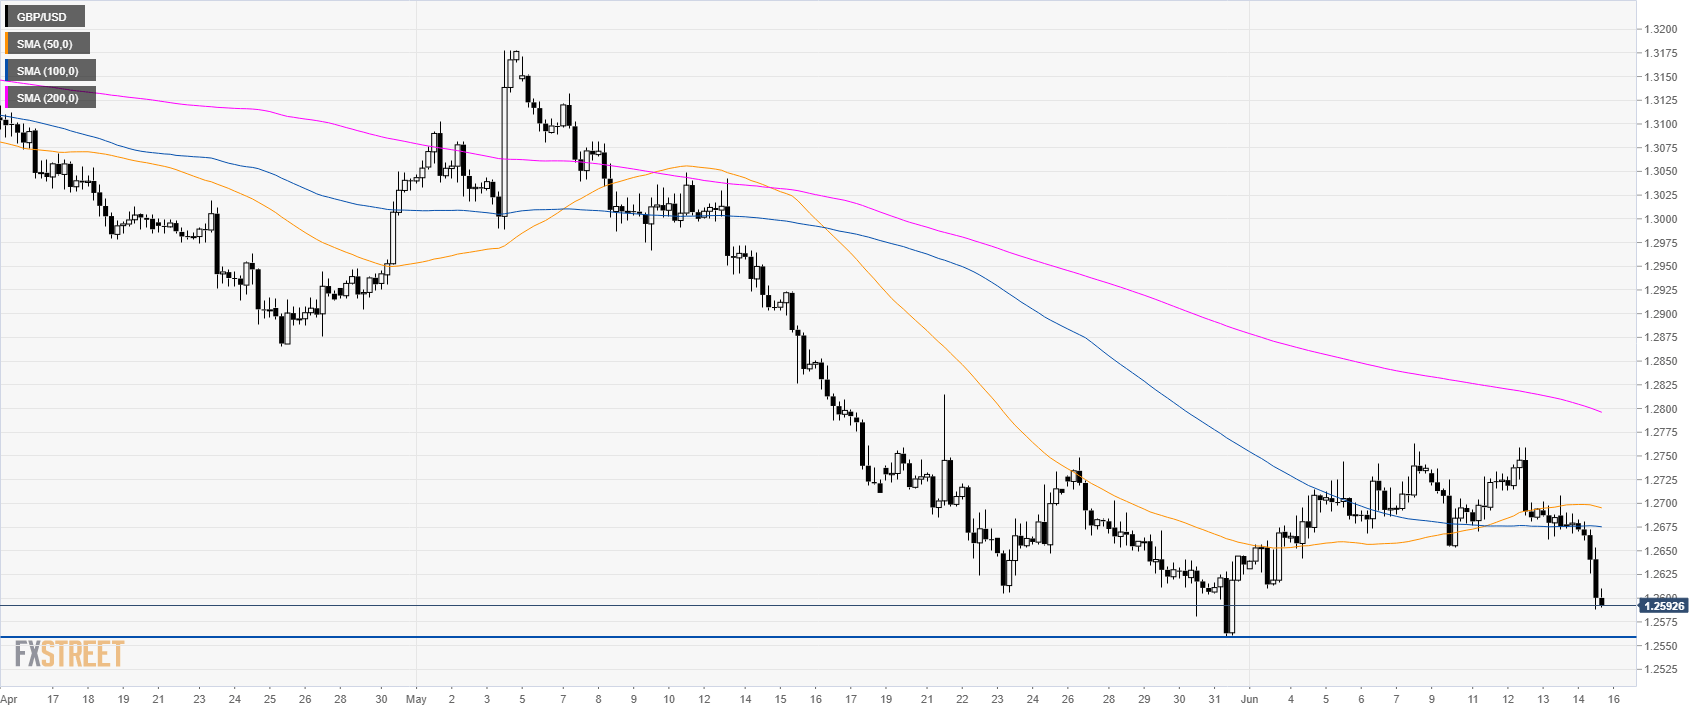
GBP/USD 4-hour chart
The market is under bearish pressure below 1.2600 and its main simple moving averages (SMAs).
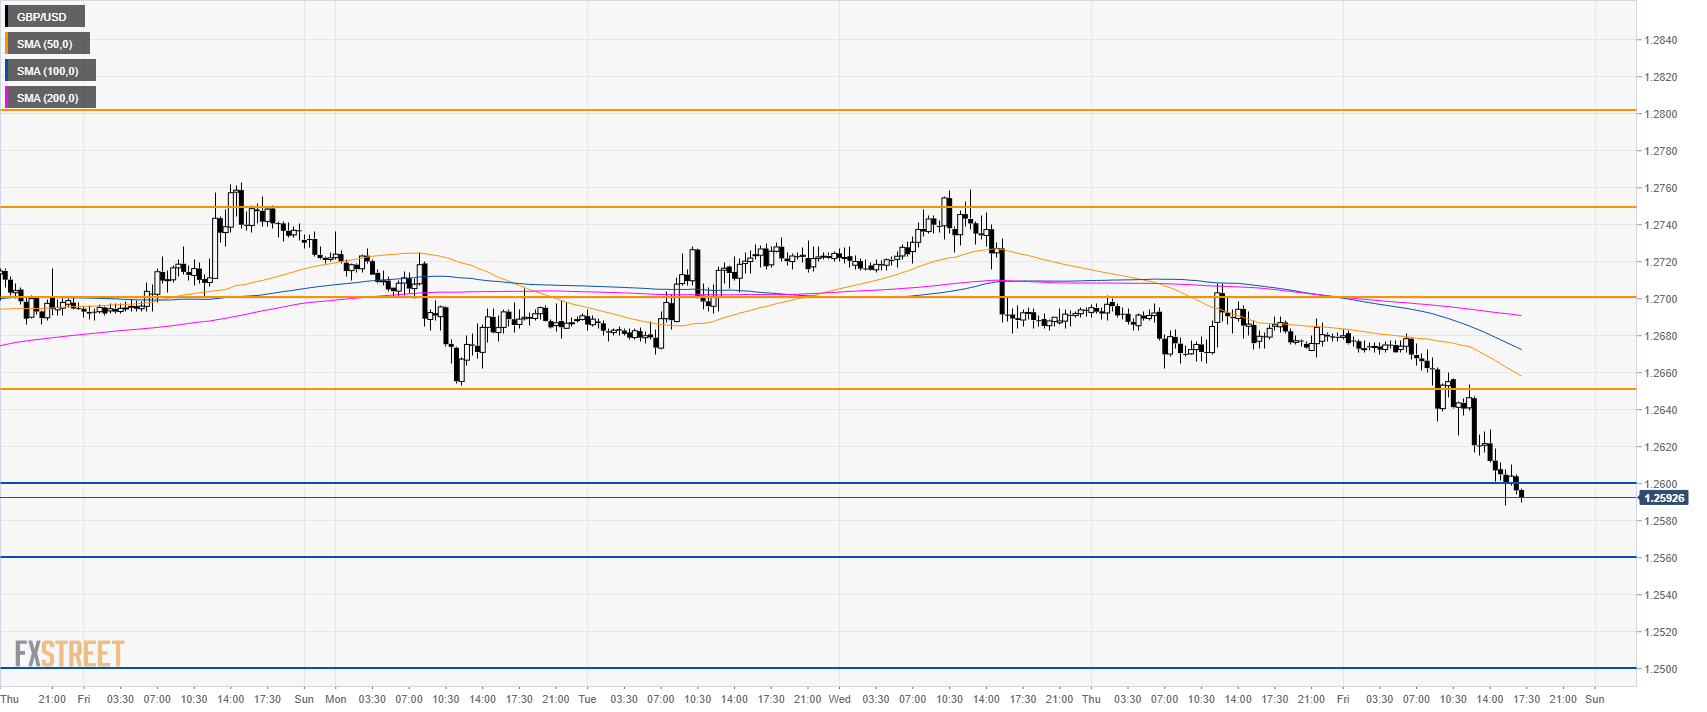
GBP/USD 30-minute chart
Bears broke below the 1.2600 figure. The market can slide down to 1.2560 and 1.2500. Resistance is at 1.2600 and 1.2650 level.
Additional key levels