14 Jun 2019
GBP/USD technical analysis: Cable ending the day on its lows below 1.2700 figure
- GBP/USD weakens below 1.2700.
- The level to beat for bears is 1.2650.
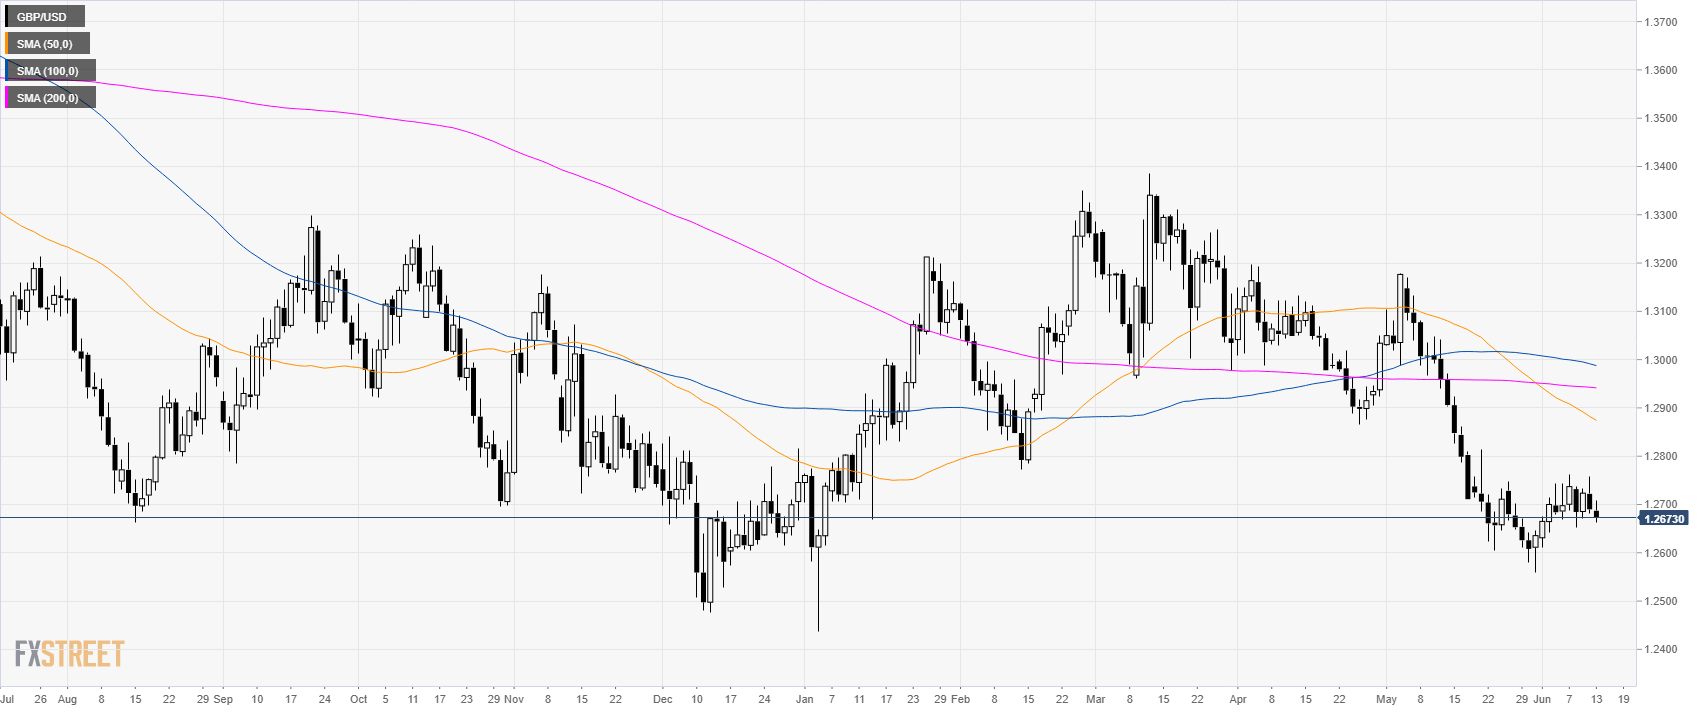
GBP/USD daily chart
GBP/USD is consolidating after the selloff seen in May.
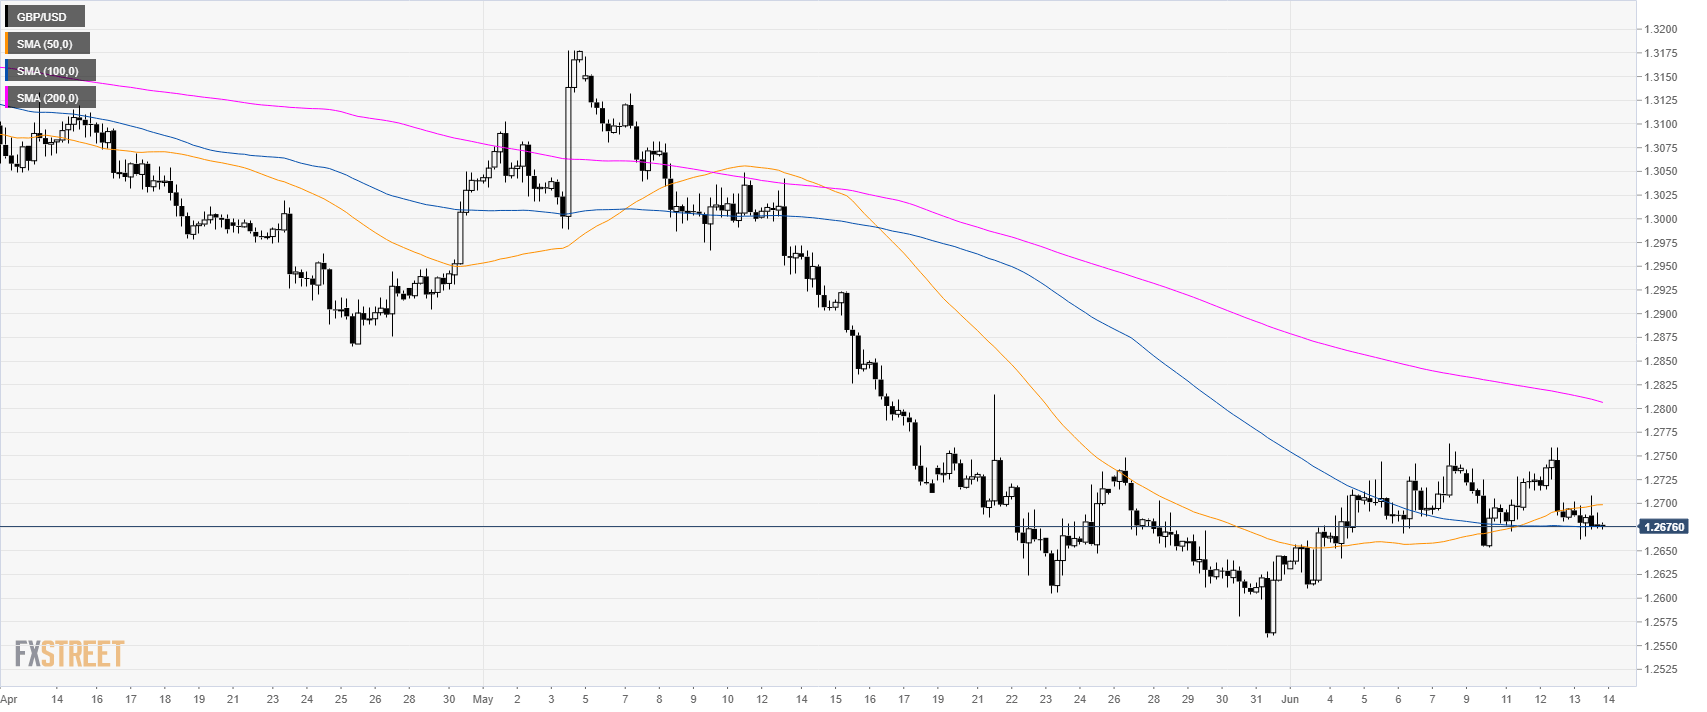
GBP/USD 4-hour chart
The market is trading below 1.2700 and its main simple moving averages (SMAs).
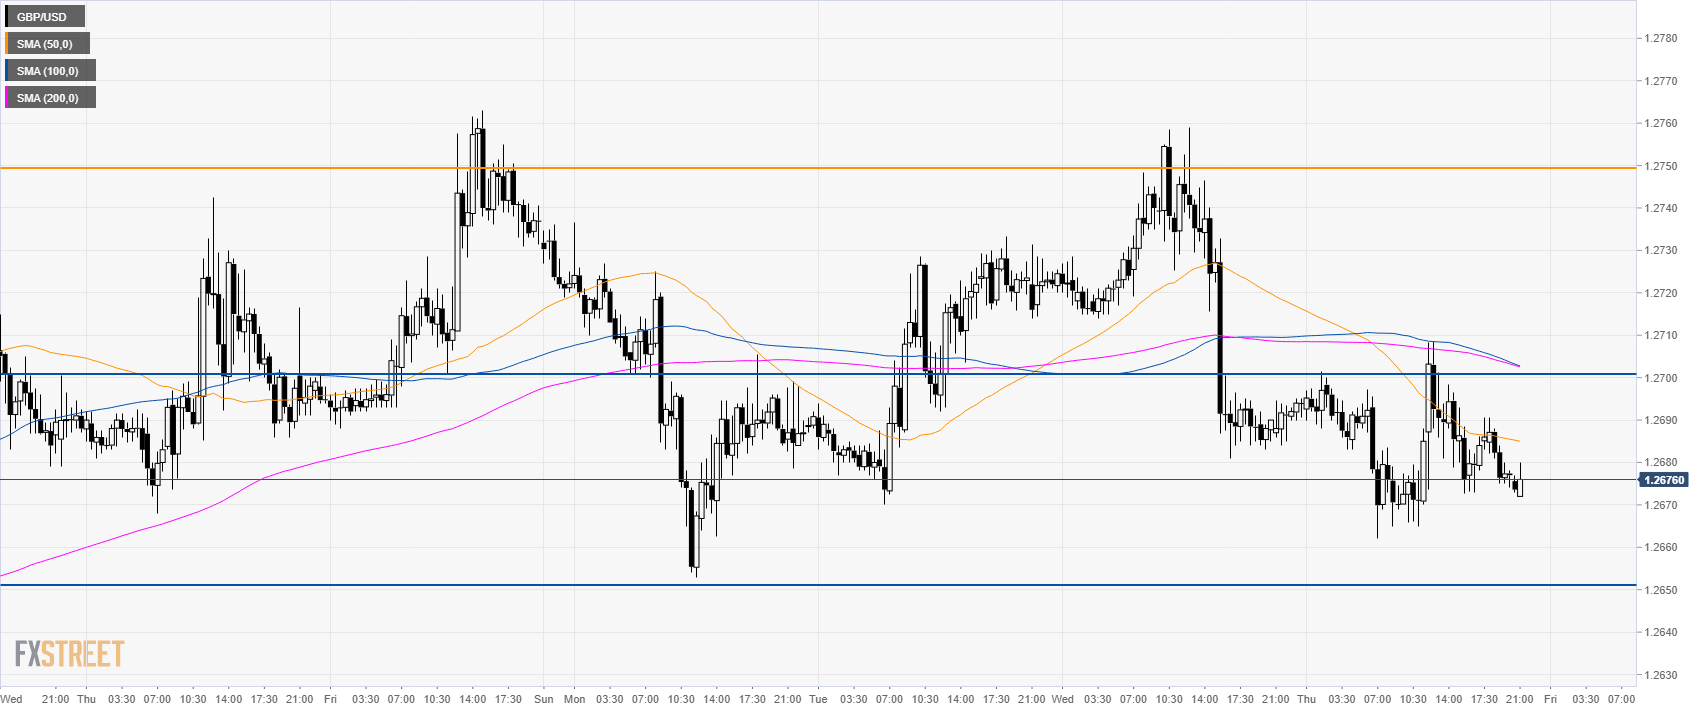
GBP/USD 30-minute chart
The range remains intact as Cable is trading between the 1.2650 and 1.2750 levels. Bears need a break below 1.2650 to reach 1.2600. Resistance is at 1.2750 and 1.2800 figure.
Additional key levels