24 Apr 2019
Oil Technical Analysis: WTI bulls keep the market upbeat above $66.00 a barrel
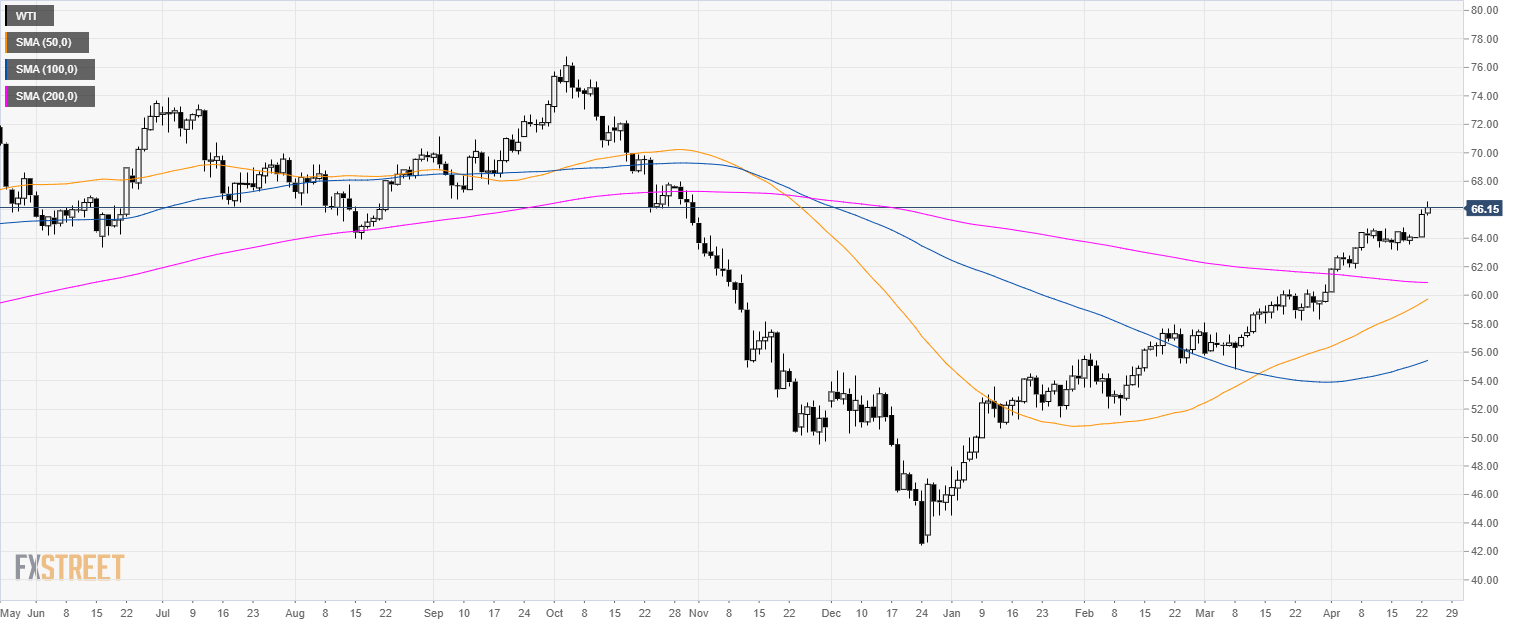
Oil daily chart
- WTI is trading in a bull trend above its main simple moving averages (SMAs).
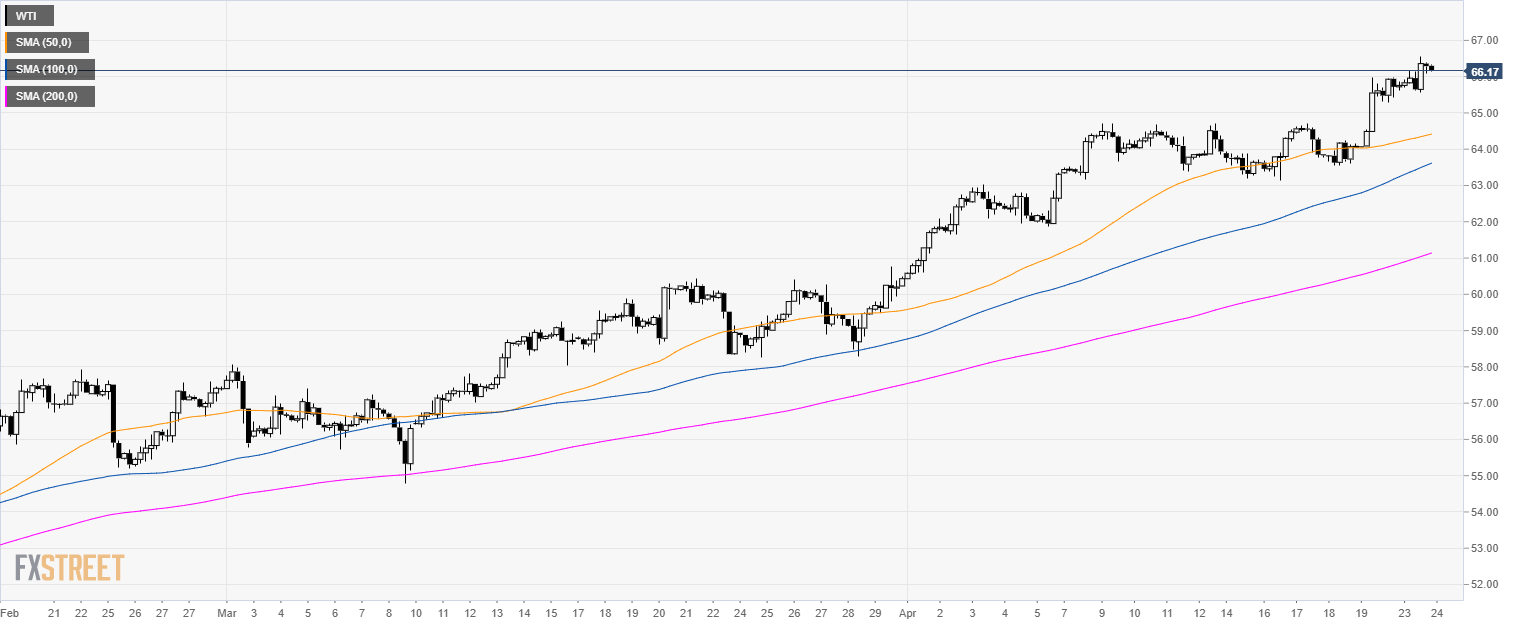
Oil 4-hour chart
- Crude oil WTI bulls keep the buying pressure above $66.00 a barrel.
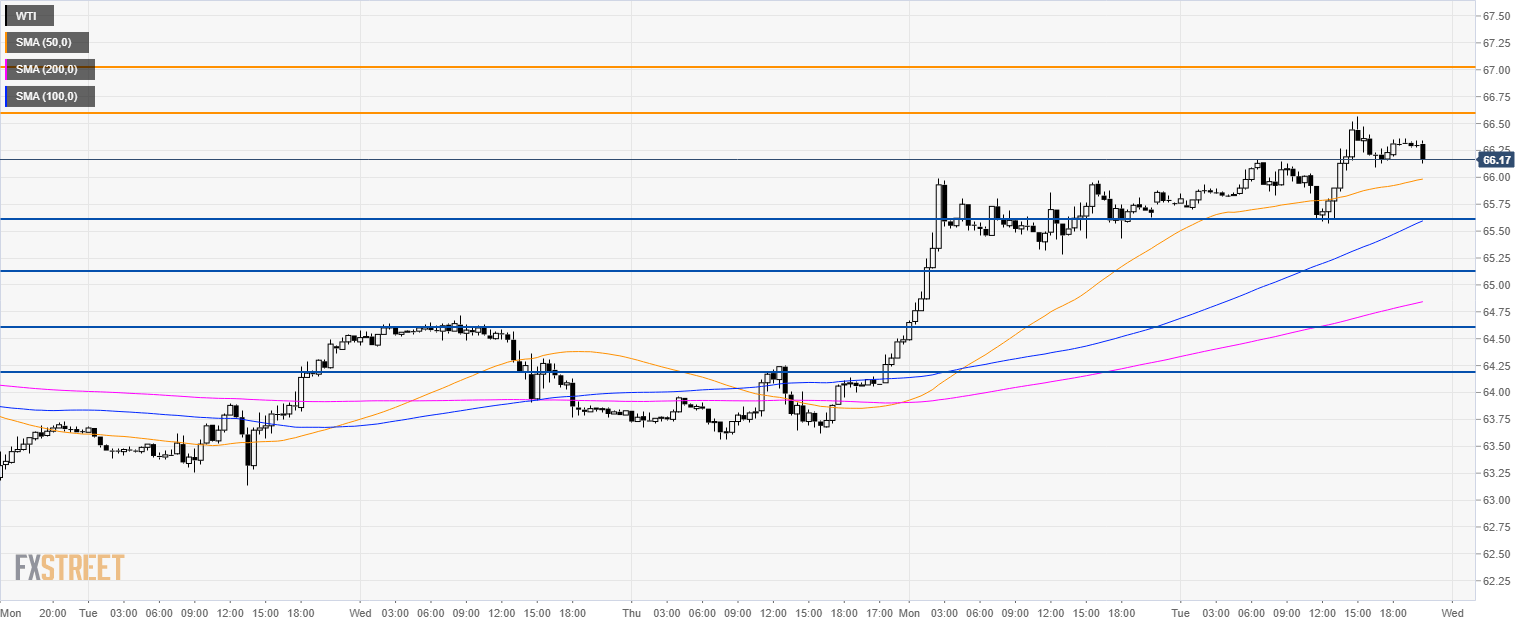
Oil 30-minute chart
- WTI is trading above its main SMAs suggesting bullish momentum in the short-term.
- The level to beat for bulls is seen at 66.60 followed by 67.00 figure.
- A correction towards 65.60 or 64.20 cannot be ruled out.
Additional key levels