23 Apr 2019
US Dollar Index Technical Analysis: DXY bulls challenging the 2019 high near 97.71 price level
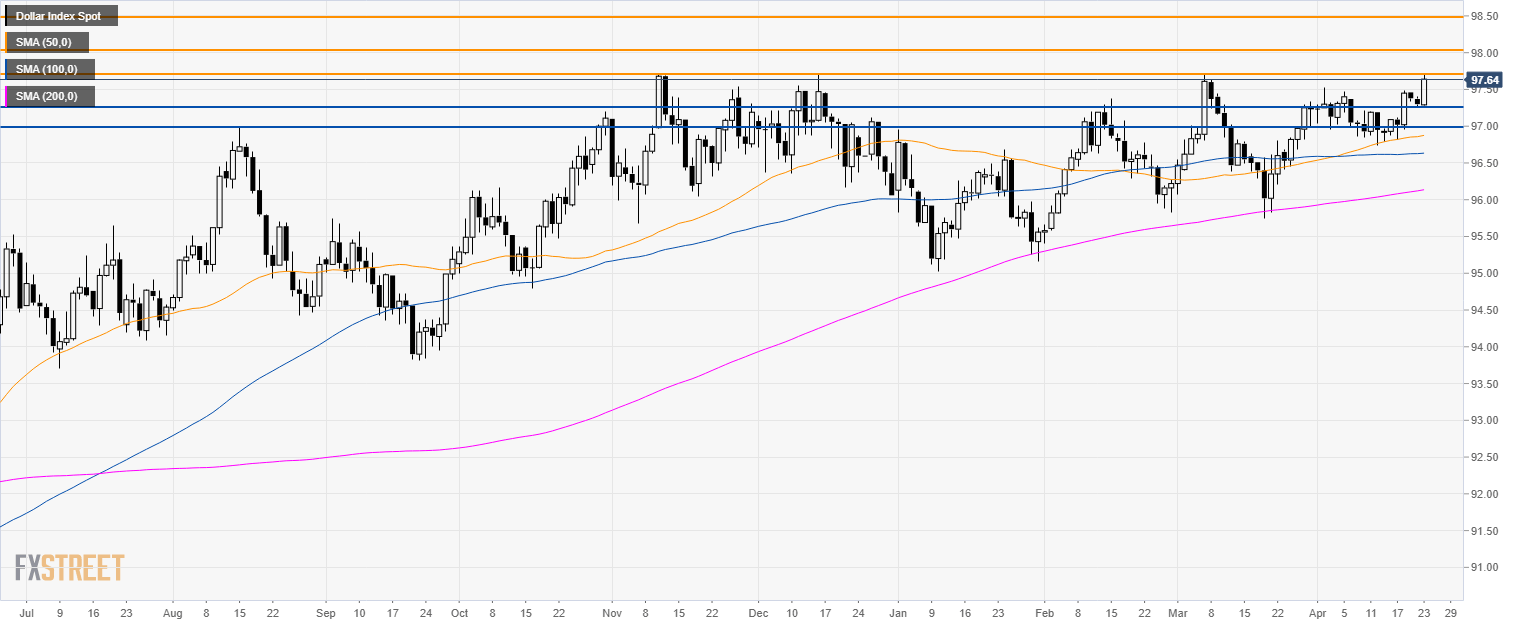
DXY daily chart
- The US Dollar Index (DXY) is trading in a bull trend above its 200-day simple moving average (SMA).
- DXY is challenging the 2019 high at the 97.71 level. If bulls manage to break above it, then 98.00 and 98.50 become the next resistances in line.
- Support is seen at 97.25 and 97.00 figure.
Additional key levels