15 Mar 2019
WTI Technical Analysis: Bulls in charge, eye 200-D SMA (62.00) while above 57.93 following third attempt breakout
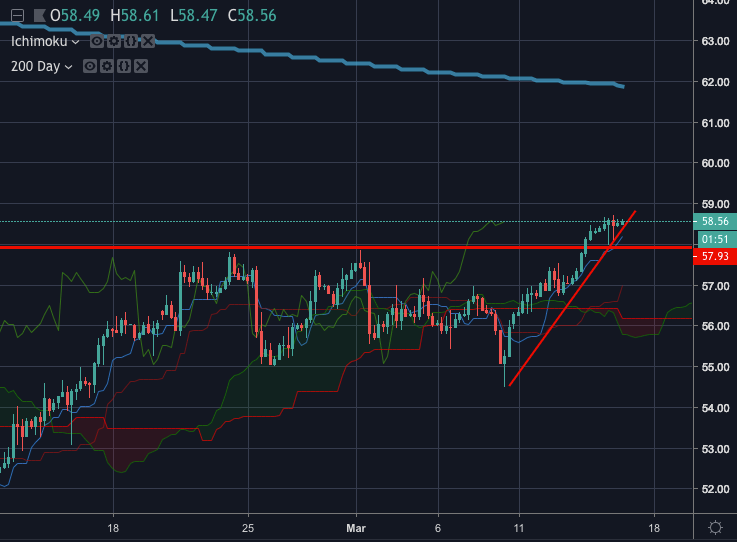
- WTI has been recovering from the recent lows below the 55 handle scored earlier this month ahead of a critical technical level around recent highs.
- Eyes are on highest levels since mid-November while above 57.93 - a horizontal and prior resistance line going back to mid-Nov 2018 which has given way on third attempt (bullish)
- A break of 59.70 and then the 61.8% Fibo of the Oct 2018 sell-off to late Dec lows at 63.74 will reveal prospects for the 200D SMA around 62.00.
- The criteria for a long is intact according to the Ichimoku Cloud:
- Price must close above the Cloud.
- Cloud ahead must be bullish (green).
- Conversion Line is greater than the base-line.
- Lagging Span is greater than or crosses above the cloud.
- Support levels: 57.68, 56.75, 56.23.
- Resistance levels: 59.13, 59.85, 60.58.