Oil Technical Analysis: WTI hits $58.00 a barrel - Highest since November 2018
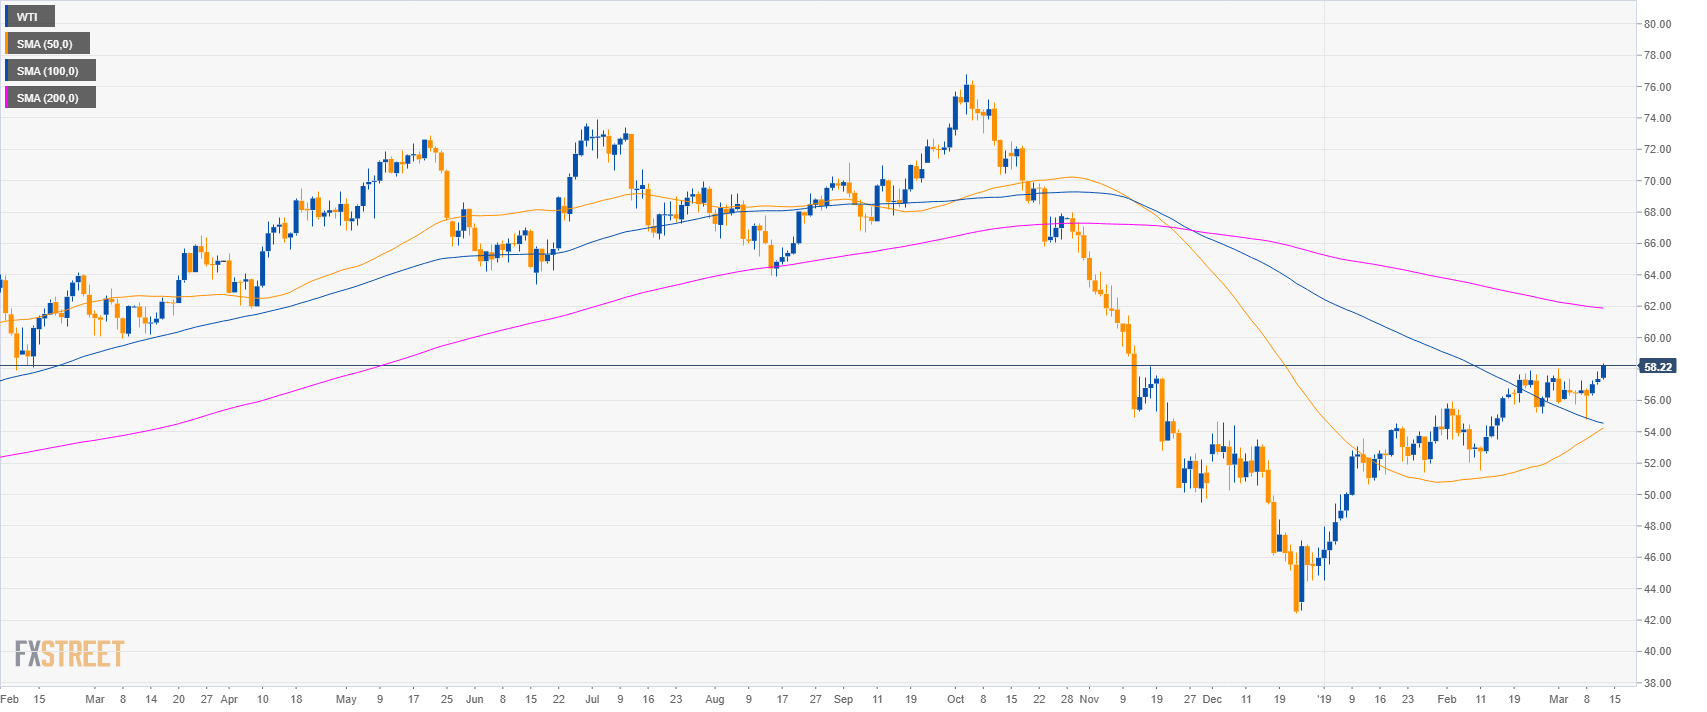
Oil daily chart
- Oil is trading above the 50 and 100-day simple moving averages (SMAs) suggesting a bullish bias.
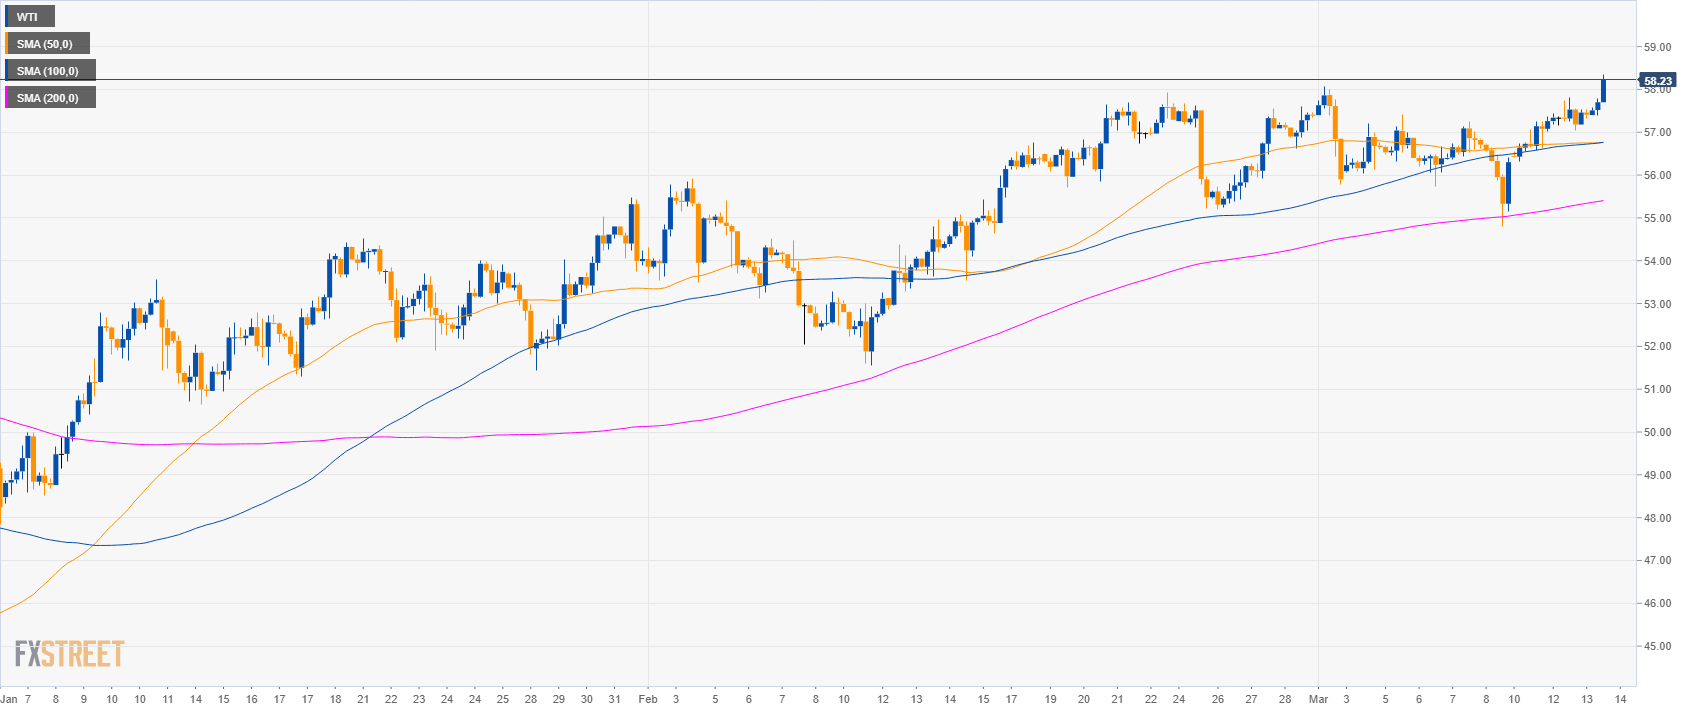
Oil 4-hour chart
- Crude oil WTI is trading above its main SMAs suggesting a bullish bias in the medium-term.
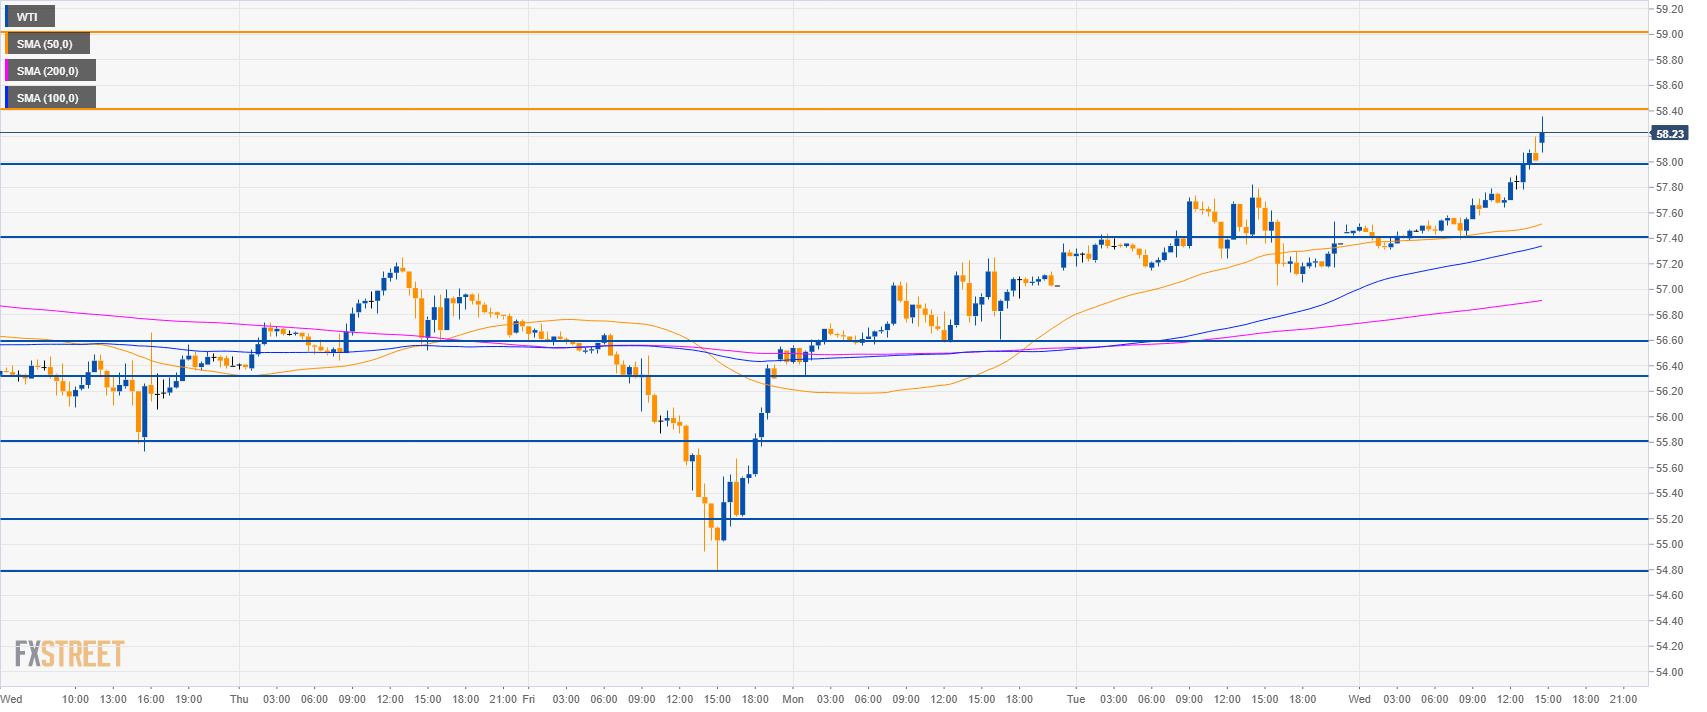
Oil 30-minute chart
- Oil is trading above its main SMAs suggesting bullish momentum in the near-term.
- Bulls are trying to break above 58.00 on a daily basis in order to travel towards 58.40 and 59.00 figure.
- To the downside, supports are at 58.00 and 57.40 level.
Additional key levels
WTI
Overview:
Today Last Price: 58.27
Today Daily change: 91 ticks
Today Daily change %: 1.59%
Today Daily Open: 57.36
Trends:
Daily SMA20: 56.44
Daily SMA50: 54.12
Daily SMA100: 53.79
Daily SMA200: 61.71
Levels:
Previous Daily High: 57.82
Previous Daily Low: 57.03
Previous Weekly High: 57.41
Previous Weekly Low: 54.79
Previous Monthly High: 57.92
Previous Monthly Low: 51.56
Daily Fibonacci 38.2%: 57.52
Daily Fibonacci 61.8%: 57.33
Daily Pivot Point S1: 56.99
Daily Pivot Point S2: 56.61
Daily Pivot Point S3: 56.2
Daily Pivot Point R1: 57.78
Daily Pivot Point R2: 58.19
Daily Pivot Point R3: 58.57