USD/JPY Technical Analysis: Greenback sidelined above 111.00 level
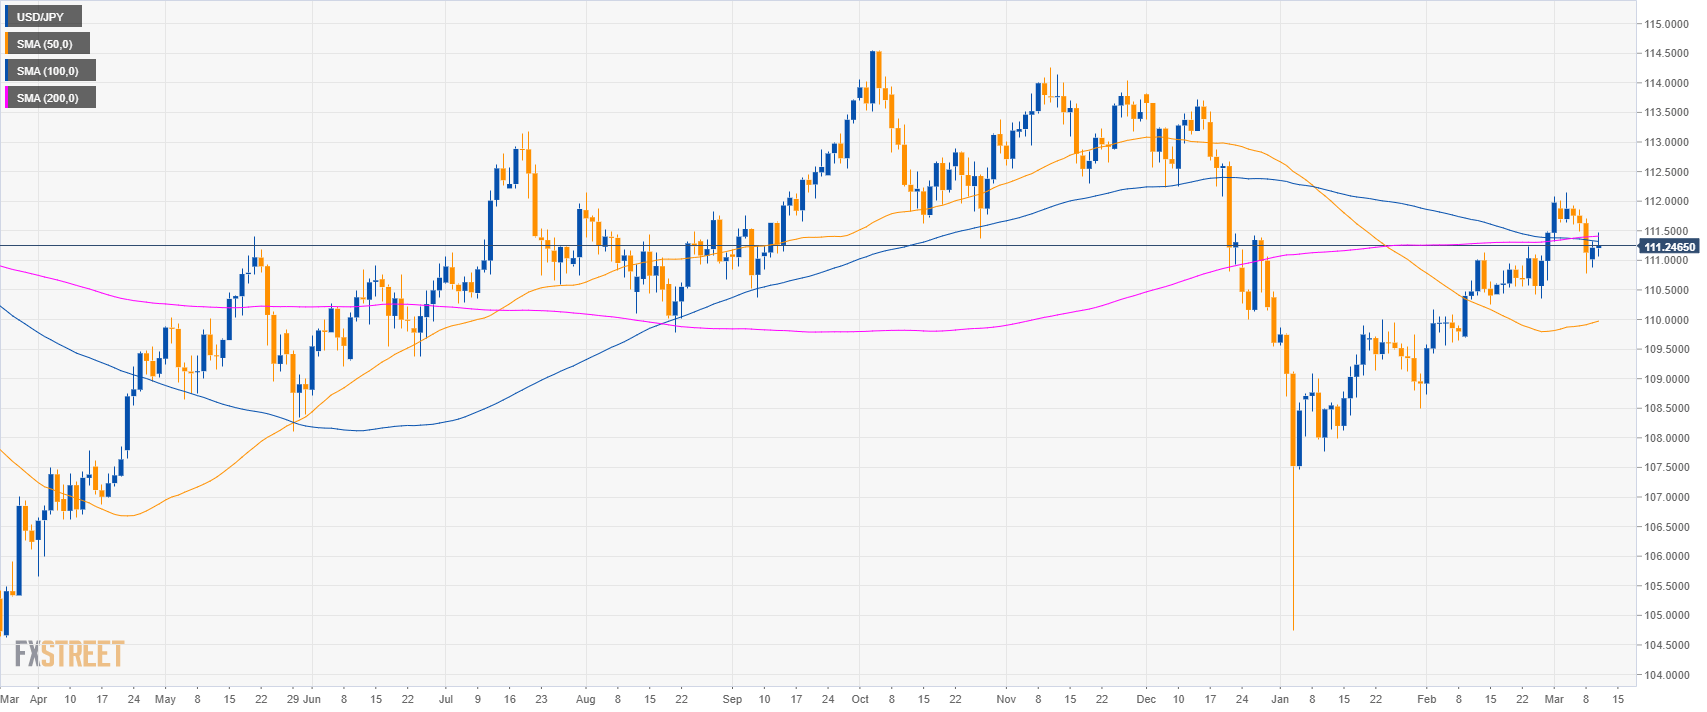
USD/JPY daily chart
- USD/JPY is trading in a sideways trend between the 50 and 200-day simple moving averages (SMAs).
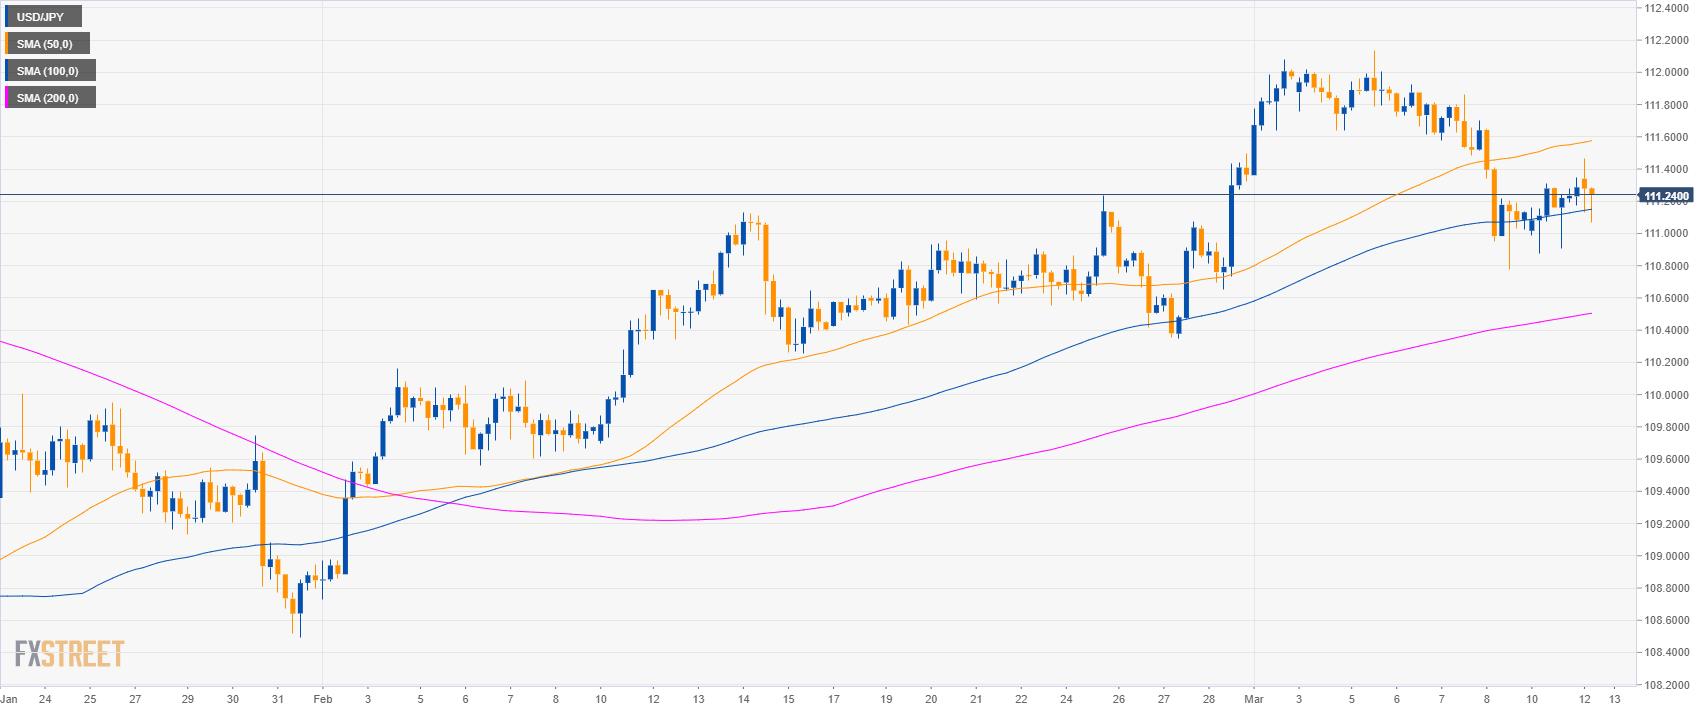
USD/JPY 4-hour chart
- USD/JPY is trading above the 100 and 200 SMAs suggesting bullish momentum in the medium-term.
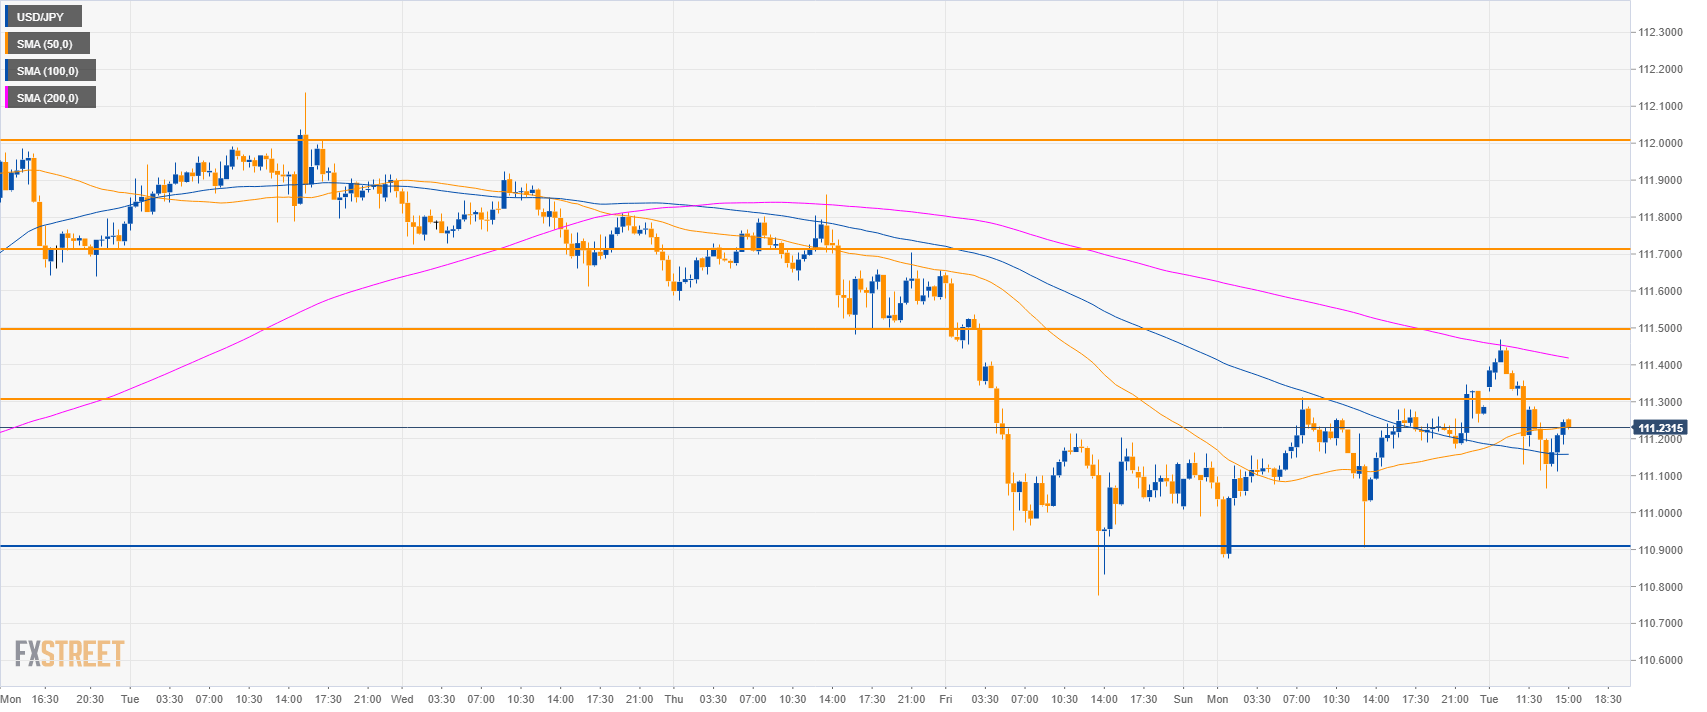
USD/JPY 30-minute chart
- USD/JPY is trading between the 50 and 200 SMAs suggesting a consolidation in the short-term.
- Bulls want to target 111.50 and break above the 200 SMA. A break above the level can lead to 110.70 and 112.00 resistances.
- Support is at 110.90 level.
Additional key levels
USD/JPY
Overview:
Today Last Price: 111.24
Today Daily change: 3 pips
Today Daily change %: 0.03%
Today Daily Open: 111.21
Trends:
Daily SMA20: 111.06
Daily SMA50: 109.94
Daily SMA100: 111.33
Daily SMA200: 111.4
Levels:
Previous Daily High: 111.31
Previous Daily Low: 110.88
Previous Weekly High: 112.14
Previous Weekly Low: 110.78
Previous Monthly High: 111.5
Previous Monthly Low: 108.73
Daily Fibonacci 38.2%: 111.14
Daily Fibonacci 61.8%: 111.04
Daily Pivot Point S1: 110.95
Daily Pivot Point S2: 110.7
Daily Pivot Point S3: 110.52
Daily Pivot Point R1: 111.39
Daily Pivot Point R2: 111.57
Daily Pivot Point R3: 111.83