GBP/USD Technical Analysis: Cable is back down below 1.3200 figure as bulls take a breather
- GBP/USD is in a bull trend above the 200-period simple moving average.
- GBP/USD found some support at 1.3170, however failure to recapture 1.3237 (October 16 high) can lead to a sideways to down consolidation in the coming days.
- The momentum remains bullish but if the market is unable to break above 1.3237, it can lead to a rotation down to 1.3140 (October 16 low) while a break above 1.3237 can open the doors to 1.3300 figure.
GBP/USD 4-hour chart
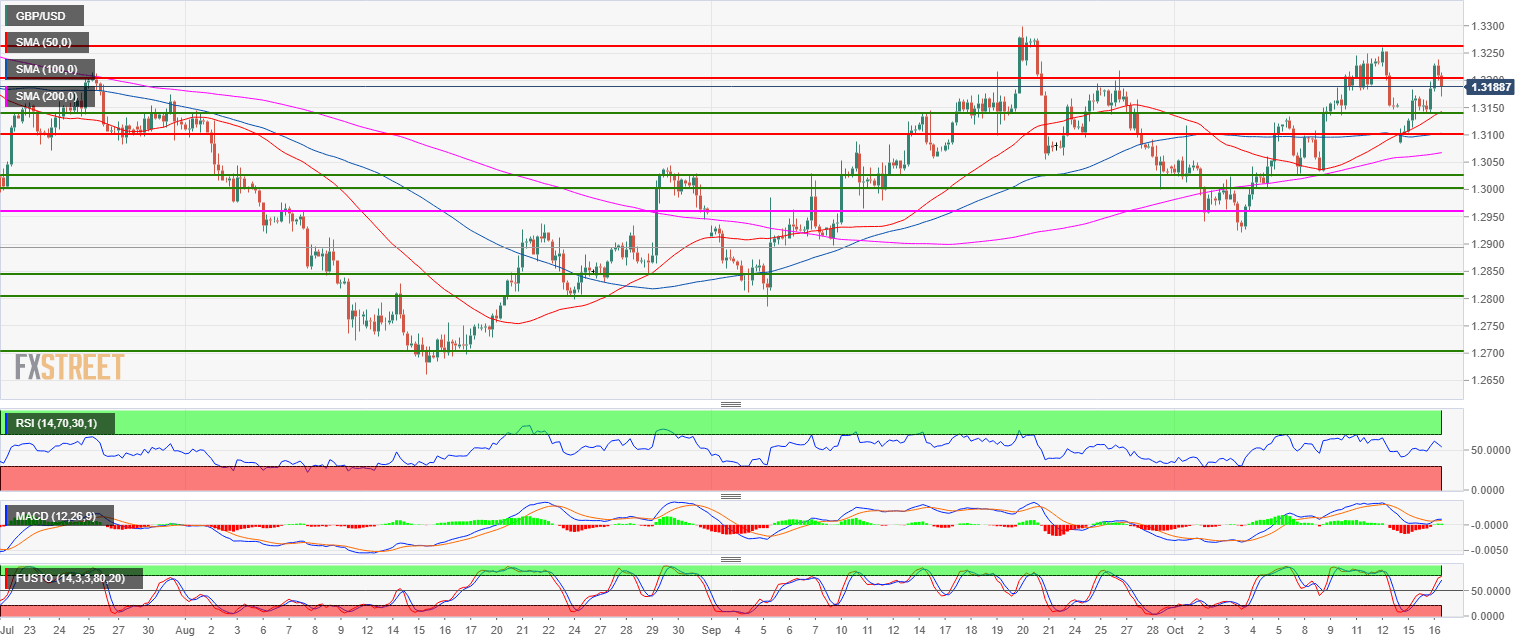
Spot rate: 1.3190
Relative change: 0.58%
High: 1.3231
Low: 1.3140
Main trend: Bullish
Resistance 1: 1.3259 October 12 high
Resistance 2: 1.3237 October 16 high
Resistance 3: 1.3300 September 20 high
Resistance 4: 1.3370 July 9 high
Resistance 5: 1.3400 figure
Support 1: 1.3200 figure
Support 2: 1.3140 current October 16 low
Support 3: 1.3100 figure
Support 4: 1.3050 August 30 swing high, key level
Support 5: 1.3028 October 8 low
Support 6: 1.3000 figure
Support 7: 1.2957 July 19 swing low