EUR/USD Price Analysis: The next upside barrier is seen at 1.0900
- EUR/USD oscillates in a narrow trading band around the mid-1.0800s on Friday.
- The pair holds above the 50- and 100-hour EMA; RSI indicator is located in bullish territory above 50.
- The immediate resistance level is seen at 1.0900; 1.0830 acts as an initial support level for the pair.
The EUR/USD pair consolidates in a narrow trading range between 1.0845 and 1.0860 during the early European session on Friday. The major pair currently trades around 1.0851, gaining 0.04% on the day.
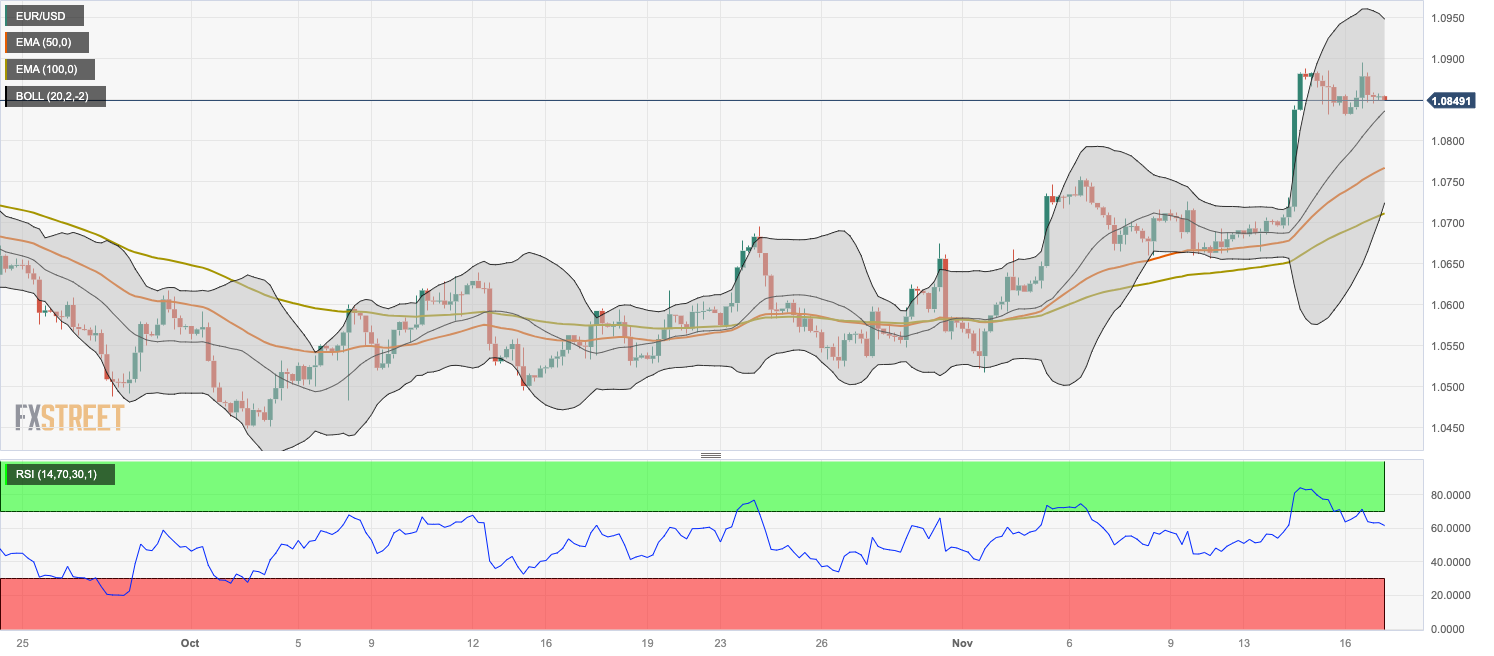
According to the four-hour chart, the major pair holds above the 50- and 100-hour Exponential Moving Averages (EMA), suggesting the path of least resistance to the upside. It’s worth noting that the Relative Strength Index (RSI) holds in bullish territory above 50, suggesting further upside looks favorable.
The immediate resistance level for EUR/USD is seen near a psychological round figure at 1.0900. Any follow-through buying will see a rally to the upper boundary of the Bollinger Band at 1.0948. The next upside barrier is located at 1.1000 (a round figure and a high of August 11).
On the other hand, a low of November 16 at 1.0830 acts as an initial support level for the pair. The next contention level will emerge at 1.0800 (round mark), en route to 1.0766 (the 50-hour EMA) and 1.0725 (the lower limit of the Bollinger Band).
EUR/USD four-hour chart