14 Nov 2022
USD Index Price Analysis: Interim up barrier comes at the 100-day SMA
- DXY’s sell-off appears to have met some contention near 106.30.
- Next on the upside now emerges the interim 100-day SMA above 109.00.
DXY sets aside two strong daily pullbacks and regains the area above 107.00 the figure at the beginning of the week.
In case bulls push harder, then the index could meet a temporary and initial hurdle at the 100-day SMA, today at 109.08, ahead of the now multi-month resistance line around 109.40.
Above the latter, the index could resume the upside in a more sustainable fashion.
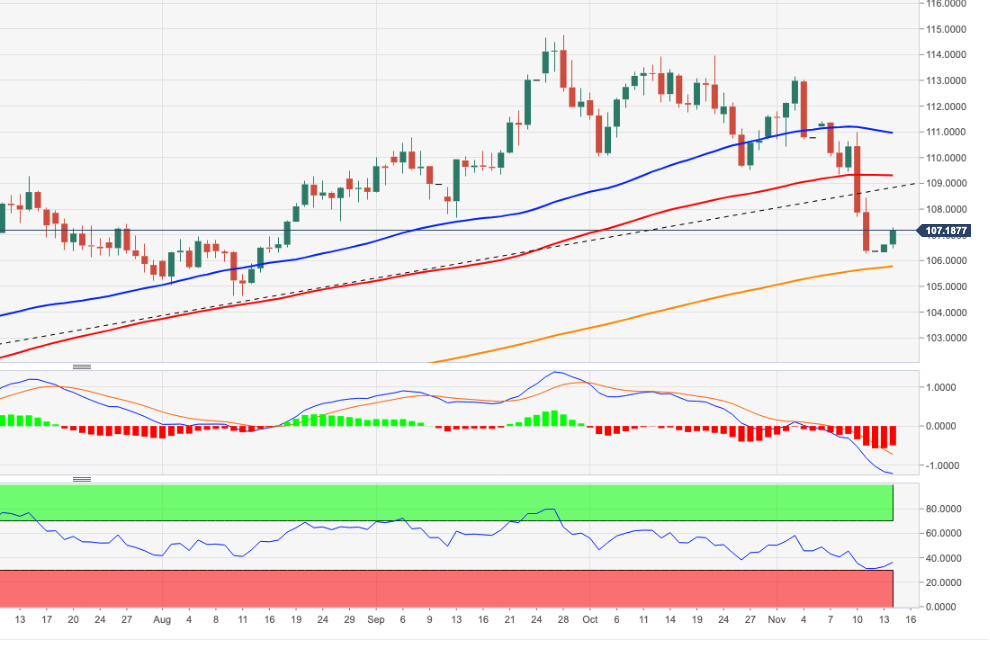
DXY daily chart