20 Apr 2020
Oil New York Price Forecast: WTI melting down to lowest since 1999
- WTI is under heavy selling pressure reaching levels not seen since 1999.
- The level to beat for bears is the 16.30 support.
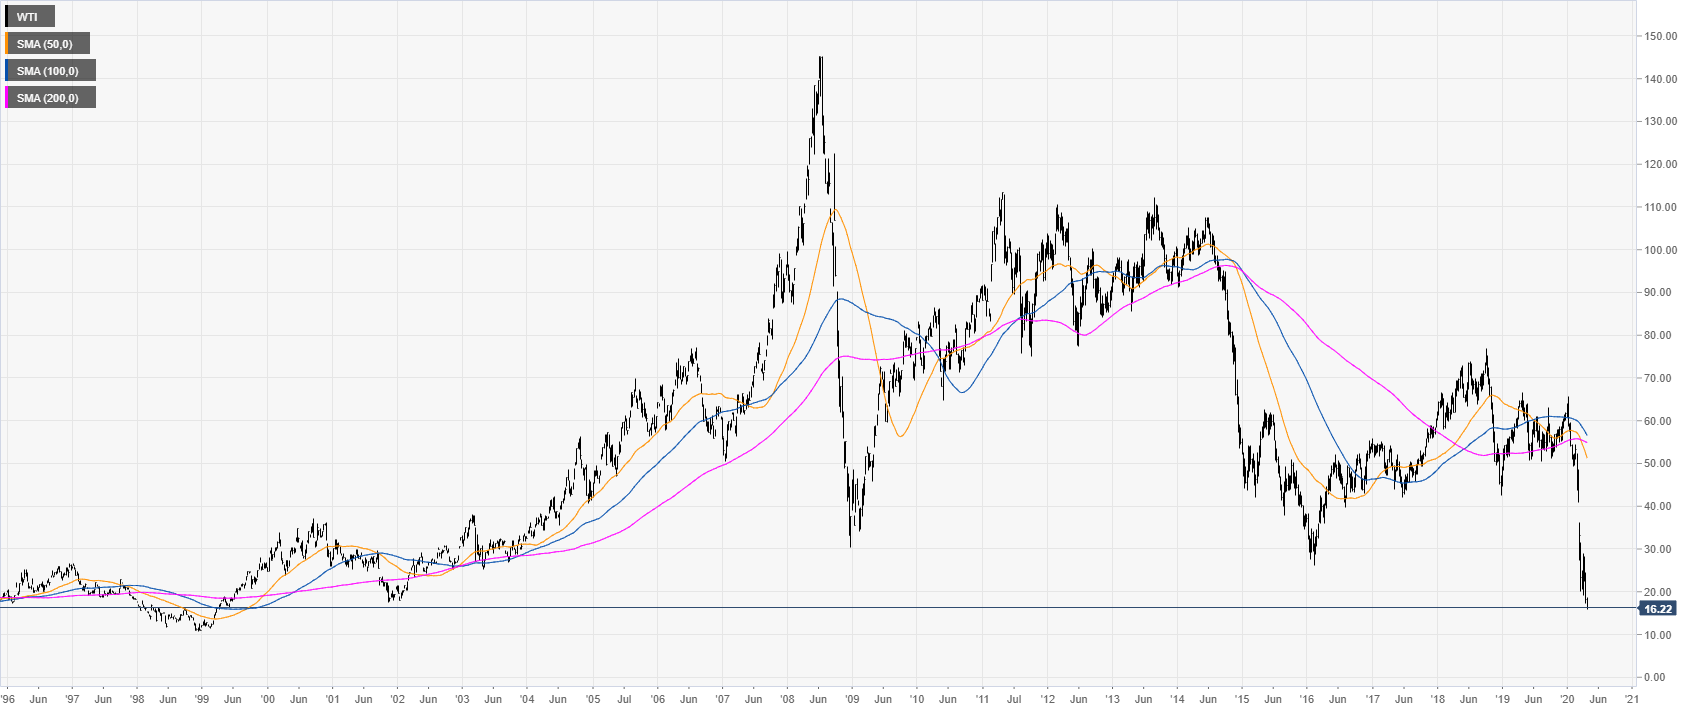
WTI weekly chart
WTI is under extreme selling pressure trading in levels not seen since 1999 as the demand for the black gold remains absent.
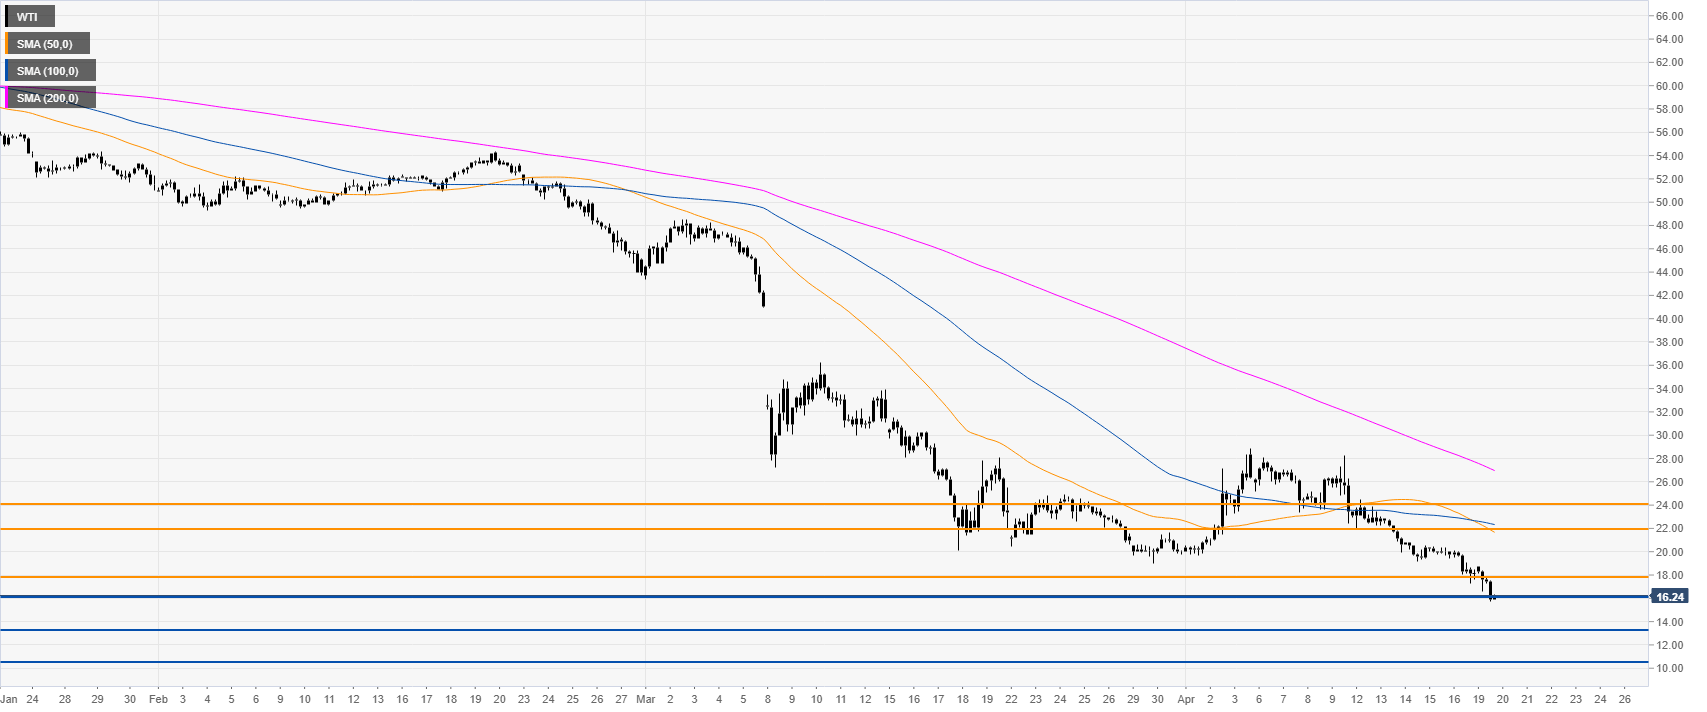
WTI four-hour chart
Sellers remain in full control of the market below the main SMAs on the four-hour chart. Black gold is challenging the 16.30 support and a break below should open the gates to more losses towards the 13.30 and 10.60 levels in the medium term. On the flip side, the market could find resistance near the 18.00, 22.00 and 24.00 price levels.
Additional key levels