WTI Price Analysis: Bounces off key support confluence around $84.50
- WTI rebounds from a fortnight low to snap four-week downtrend.
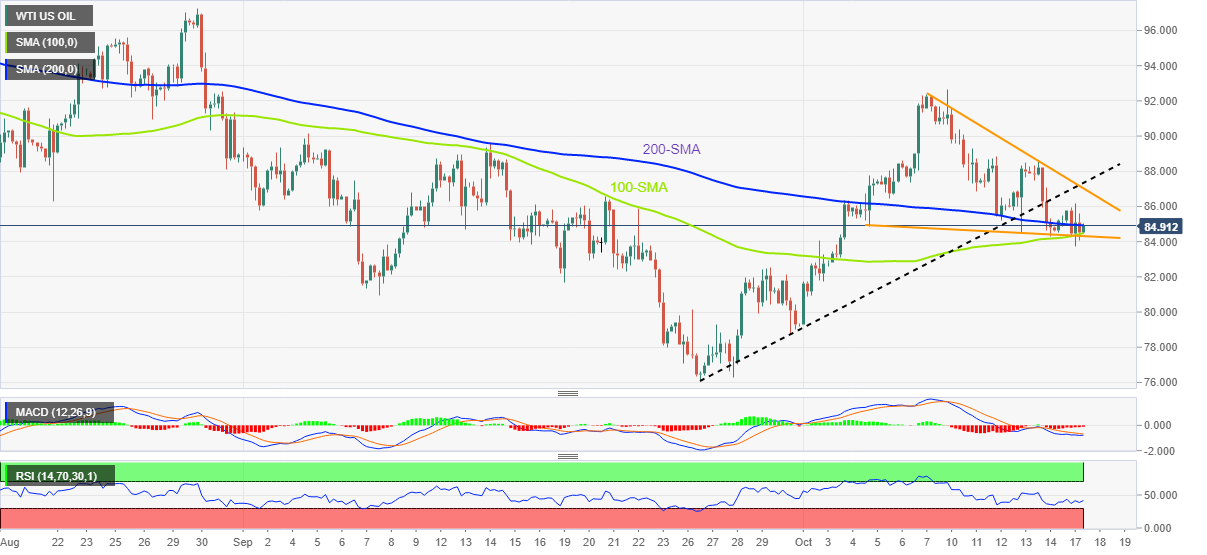
- 100-SMA, two-week-old support line restricts immediate downside amid sluggish oscillators.
- Buyers need validation from a convergence of previous support, weekly resistance trend lines.
WTI crude oil prices keep recovery from the $84.50 support, around $84.90 during Tuesday’s Asian session. In doing so, the black gold snaps four-week downtrend while bouncing off the convergence off a 100-SMA and a two-week-old descending trend line.
It should, however, be noted that the sluggish RSI and MACD challenges the WTI buyers as they poke the 200-SMA hurdle, around $85.00 by the press time.
Even if the black gold crosses the $95.00 SMA resistance, a confluence of the one-week-old descending trend line and the support-turned-resistance line from September 26, around $87.00, will be a major challenge for the bulls.
Should the quote manage to stay firmer past $87.00, the monthly peak of $92.63 should gain the market’s attention.
Alternatively, downside break of the $84.50 support could quickly drag the WTI crude oil prices towards the September 30 swing high near $82.50.
Following that, the early September’s low near $80.90 and the $80.00 threshold may entertain the oil bears before directing them to the previous monthly low of $76.08.
WTI: Four-hour chart
Trend: Limited recovery expected